Immigrants from Congo vs Immigrants from Nigeria Receiving Food Stamps
COMPARE
Immigrants from Congo
Immigrants from Nigeria
Receiving Food Stamps
Receiving Food Stamps Comparison
Immigrants from Congo
Immigrants from Nigeria
14.1%
RECEIVING FOOD STAMPS
0.3/ 100
METRIC RATING
261st/ 347
METRIC RANK
13.1%
RECEIVING FOOD STAMPS
3.4/ 100
METRIC RATING
231st/ 347
METRIC RANK
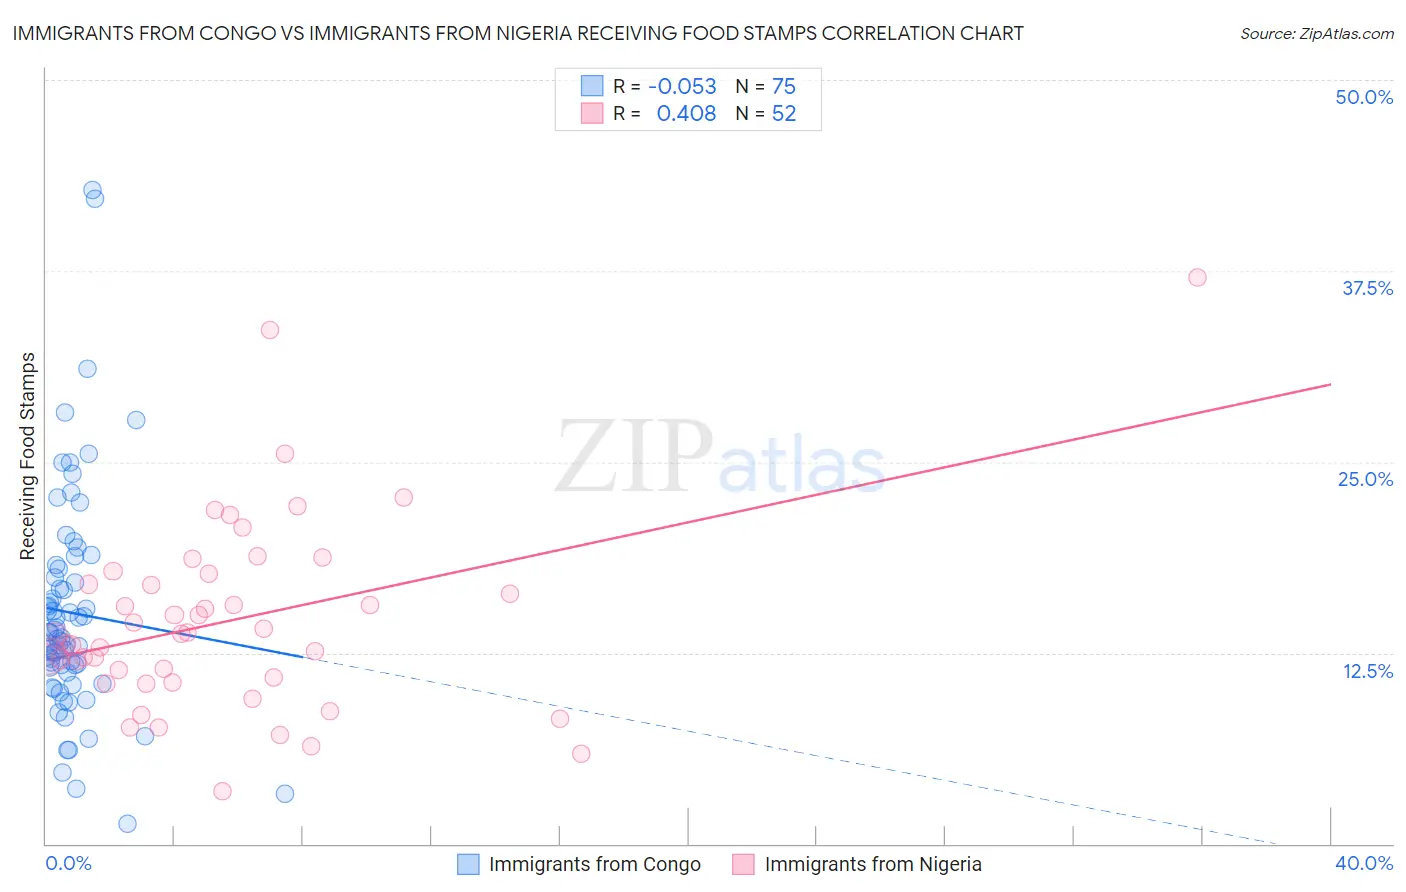
Immigrants from Congo vs Immigrants from Nigeria Receiving Food Stamps Correlation Chart
The statistical analysis conducted on geographies consisting of 92,058,964 people shows a slight negative correlation between the proportion of Immigrants from Congo and percentage of population receiving government assistance and/or food stamps in the United States with a correlation coefficient (R) of -0.053 and weighted average of 14.1%. Similarly, the statistical analysis conducted on geographies consisting of 282,993,216 people shows a moderate positive correlation between the proportion of Immigrants from Nigeria and percentage of population receiving government assistance and/or food stamps in the United States with a correlation coefficient (R) of 0.408 and weighted average of 13.1%, a difference of 7.9%.
Receiving Food Stamps Correlation Summary
| Measurement | Immigrants from Congo | Immigrants from Nigeria |
| Minimum | 1.3% | 3.4% |
| Maximum | 42.8% | 37.1% |
| Range | 41.5% | 33.7% |
| Mean | 15.1% | 14.6% |
| Median | 13.5% | 13.7% |
| Interquartile 25% (IQ1) | 11.2% | 10.7% |
| Interquartile 75% (IQ3) | 18.0% | 17.3% |
| Interquartile Range (IQR) | 6.8% | 6.6% |
| Standard Deviation (Sample) | 7.4% | 6.3% |
| Standard Deviation (Population) | 7.4% | 6.2% |
Similar Demographics by Receiving Food Stamps
Demographics Similar to Immigrants from Congo by Receiving Food Stamps
In terms of receiving food stamps, the demographic groups most similar to Immigrants from Congo are Central American (14.1%, a difference of 0.010%), Creek (14.1%, a difference of 0.11%), Immigrants from Ghana (14.1%, a difference of 0.23%), Arapaho (14.1%, a difference of 0.31%), and Japanese (14.1%, a difference of 0.41%).
| Demographics | Rating | Rank | Receiving Food Stamps |
| Marshallese | 0.3 /100 | #254 | Tragic 14.1% |
| Sub-Saharan Africans | 0.3 /100 | #255 | Tragic 14.1% |
| Japanese | 0.3 /100 | #256 | Tragic 14.1% |
| Arapaho | 0.3 /100 | #257 | Tragic 14.1% |
| Immigrants | Ghana | 0.3 /100 | #258 | Tragic 14.1% |
| Creek | 0.3 /100 | #259 | Tragic 14.1% |
| Central Americans | 0.3 /100 | #260 | Tragic 14.1% |
| Immigrants | Congo | 0.3 /100 | #261 | Tragic 14.1% |
| Paiute | 0.2 /100 | #262 | Tragic 14.3% |
| Immigrants | Portugal | 0.2 /100 | #263 | Tragic 14.3% |
| Immigrants | Uzbekistan | 0.2 /100 | #264 | Tragic 14.3% |
| Blackfeet | 0.2 /100 | #265 | Tragic 14.3% |
| Cheyenne | 0.2 /100 | #266 | Tragic 14.3% |
| Dutch West Indians | 0.2 /100 | #267 | Tragic 14.3% |
| Guatemalans | 0.1 /100 | #268 | Tragic 14.4% |
Demographics Similar to Immigrants from Nigeria by Receiving Food Stamps
In terms of receiving food stamps, the demographic groups most similar to Immigrants from Nigeria are Puget Sound Salish (13.1%, a difference of 0.040%), Ottawa (13.1%, a difference of 0.090%), Panamanian (13.1%, a difference of 0.10%), Nigerian (13.1%, a difference of 0.11%), and Chickasaw (13.1%, a difference of 0.15%).
| Demographics | Rating | Rank | Receiving Food Stamps |
| Immigrants | Armenia | 4.3 /100 | #224 | Tragic 13.0% |
| Fijians | 4.3 /100 | #225 | Tragic 13.0% |
| Chickasaw | 3.6 /100 | #226 | Tragic 13.1% |
| Nigerians | 3.5 /100 | #227 | Tragic 13.1% |
| Panamanians | 3.5 /100 | #228 | Tragic 13.1% |
| Ottawa | 3.5 /100 | #229 | Tragic 13.1% |
| Puget Sound Salish | 3.4 /100 | #230 | Tragic 13.1% |
| Immigrants | Nigeria | 3.4 /100 | #231 | Tragic 13.1% |
| Salvadorans | 2.7 /100 | #232 | Tragic 13.2% |
| Cherokee | 2.5 /100 | #233 | Tragic 13.2% |
| Comanche | 2.4 /100 | #234 | Tragic 13.3% |
| Immigrants | Zaire | 1.9 /100 | #235 | Tragic 13.4% |
| Crow | 1.6 /100 | #236 | Tragic 13.4% |
| Immigrants | El Salvador | 1.5 /100 | #237 | Tragic 13.5% |
| French American Indians | 1.4 /100 | #238 | Tragic 13.5% |