Immigrants from Congo vs Immigrants from Sierra Leone Receiving Food Stamps
COMPARE
Immigrants from Congo
Immigrants from Sierra Leone
Receiving Food Stamps
Receiving Food Stamps Comparison
Immigrants from Congo
Immigrants from Sierra Leone
14.1%
RECEIVING FOOD STAMPS
0.3/ 100
METRIC RATING
261st/ 347
METRIC RANK
12.5%
RECEIVING FOOD STAMPS
12.9/ 100
METRIC RATING
209th/ 347
METRIC RANK
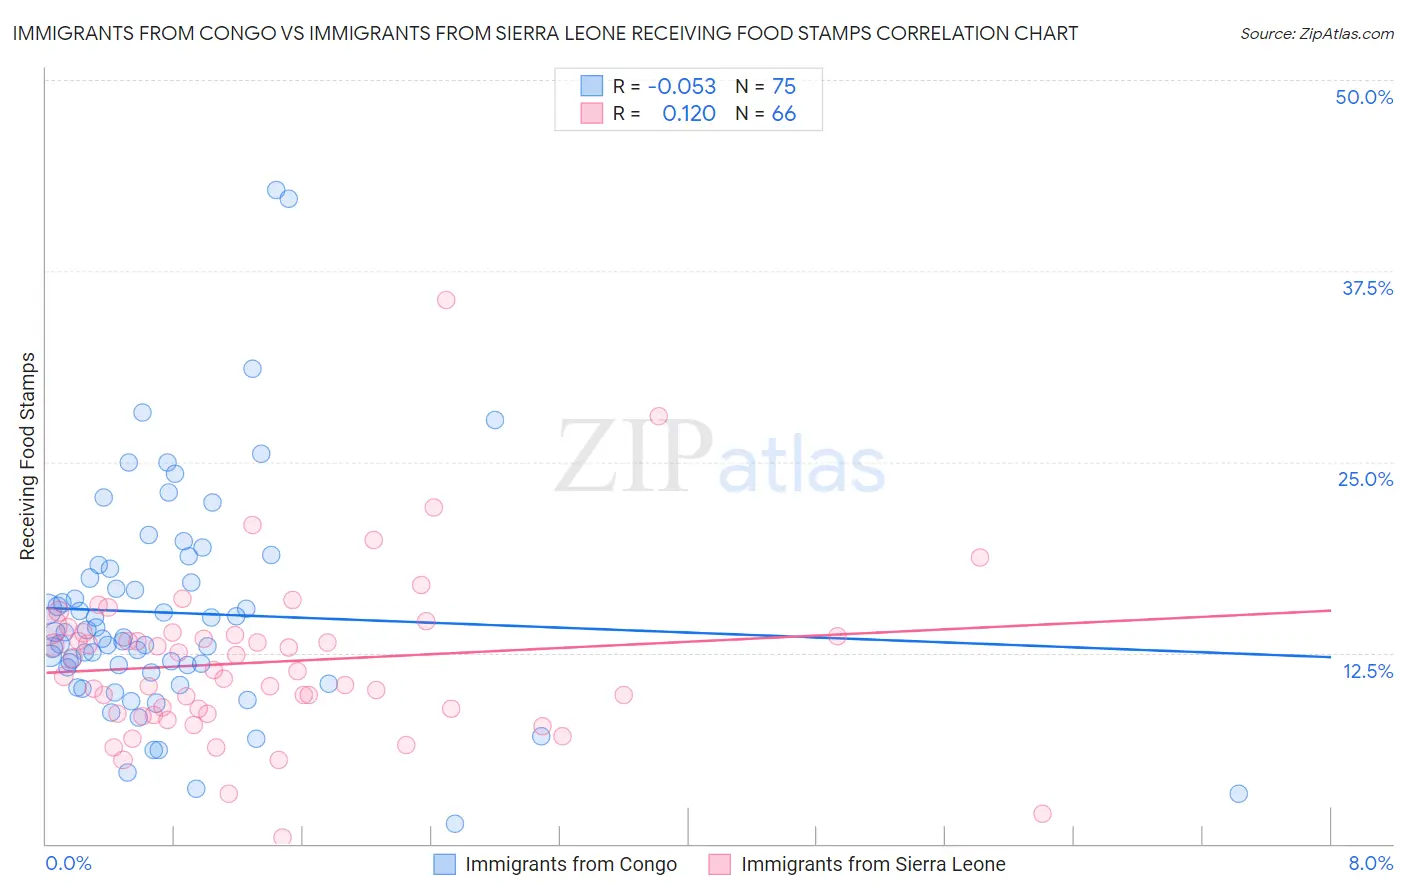
Immigrants from Congo vs Immigrants from Sierra Leone Receiving Food Stamps Correlation Chart
The statistical analysis conducted on geographies consisting of 92,058,964 people shows a slight negative correlation between the proportion of Immigrants from Congo and percentage of population receiving government assistance and/or food stamps in the United States with a correlation coefficient (R) of -0.053 and weighted average of 14.1%. Similarly, the statistical analysis conducted on geographies consisting of 101,602,501 people shows a poor positive correlation between the proportion of Immigrants from Sierra Leone and percentage of population receiving government assistance and/or food stamps in the United States with a correlation coefficient (R) of 0.120 and weighted average of 12.5%, a difference of 13.0%.
Receiving Food Stamps Correlation Summary
| Measurement | Immigrants from Congo | Immigrants from Sierra Leone |
| Minimum | 1.3% | 0.40% |
| Maximum | 42.8% | 35.6% |
| Range | 41.5% | 35.2% |
| Mean | 15.1% | 11.9% |
| Median | 13.5% | 11.3% |
| Interquartile 25% (IQ1) | 11.2% | 8.5% |
| Interquartile 75% (IQ3) | 18.0% | 13.8% |
| Interquartile Range (IQR) | 6.8% | 5.3% |
| Standard Deviation (Sample) | 7.4% | 5.5% |
| Standard Deviation (Population) | 7.4% | 5.4% |
Similar Demographics by Receiving Food Stamps
Demographics Similar to Immigrants from Congo by Receiving Food Stamps
In terms of receiving food stamps, the demographic groups most similar to Immigrants from Congo are Central American (14.1%, a difference of 0.010%), Creek (14.1%, a difference of 0.11%), Immigrants from Ghana (14.1%, a difference of 0.23%), Arapaho (14.1%, a difference of 0.31%), and Japanese (14.1%, a difference of 0.41%).
| Demographics | Rating | Rank | Receiving Food Stamps |
| Marshallese | 0.3 /100 | #254 | Tragic 14.1% |
| Sub-Saharan Africans | 0.3 /100 | #255 | Tragic 14.1% |
| Japanese | 0.3 /100 | #256 | Tragic 14.1% |
| Arapaho | 0.3 /100 | #257 | Tragic 14.1% |
| Immigrants | Ghana | 0.3 /100 | #258 | Tragic 14.1% |
| Creek | 0.3 /100 | #259 | Tragic 14.1% |
| Central Americans | 0.3 /100 | #260 | Tragic 14.1% |
| Immigrants | Congo | 0.3 /100 | #261 | Tragic 14.1% |
| Paiute | 0.2 /100 | #262 | Tragic 14.3% |
| Immigrants | Portugal | 0.2 /100 | #263 | Tragic 14.3% |
| Immigrants | Uzbekistan | 0.2 /100 | #264 | Tragic 14.3% |
| Blackfeet | 0.2 /100 | #265 | Tragic 14.3% |
| Cheyenne | 0.2 /100 | #266 | Tragic 14.3% |
| Dutch West Indians | 0.2 /100 | #267 | Tragic 14.3% |
| Guatemalans | 0.1 /100 | #268 | Tragic 14.4% |
Demographics Similar to Immigrants from Sierra Leone by Receiving Food Stamps
In terms of receiving food stamps, the demographic groups most similar to Immigrants from Sierra Leone are Immigrants from Uruguay (12.5%, a difference of 0.030%), Potawatomi (12.5%, a difference of 0.47%), South American (12.4%, a difference of 0.83%), Colombian (12.6%, a difference of 0.86%), and Immigrants from Thailand (12.4%, a difference of 1.1%).
| Demographics | Rating | Rank | Receiving Food Stamps |
| Immigrants | Venezuela | 20.1 /100 | #202 | Fair 12.3% |
| Shoshone | 17.7 /100 | #203 | Poor 12.4% |
| Immigrants | Nonimmigrants | 17.6 /100 | #204 | Poor 12.4% |
| Aleuts | 17.3 /100 | #205 | Poor 12.4% |
| Immigrants | Thailand | 17.0 /100 | #206 | Poor 12.4% |
| South Americans | 16.0 /100 | #207 | Poor 12.4% |
| Potawatomi | 14.6 /100 | #208 | Poor 12.5% |
| Immigrants | Sierra Leone | 12.9 /100 | #209 | Poor 12.5% |
| Immigrants | Uruguay | 12.8 /100 | #210 | Poor 12.5% |
| Colombians | 10.2 /100 | #211 | Poor 12.6% |
| Malaysians | 8.5 /100 | #212 | Tragic 12.7% |
| Moroccans | 7.6 /100 | #213 | Tragic 12.8% |
| Immigrants | Africa | 7.6 /100 | #214 | Tragic 12.8% |
| Native Hawaiians | 6.7 /100 | #215 | Tragic 12.8% |
| Immigrants | South America | 6.5 /100 | #216 | Tragic 12.8% |