Immigrants from Colombia vs Trinidadian and Tobagonian Unemployment Among Ages 20 to 24 years
COMPARE
Immigrants from Colombia
Trinidadian and Tobagonian
Unemployment Among Ages 20 to 24 years
Unemployment Among Ages 20 to 24 years Comparison
Immigrants from Colombia
Trinidadians and Tobagonians
10.3%
UNEMPLOYMENT AMONG AGES 20 TO 24 YEARS
56.3/ 100
METRIC RATING
169th/ 347
METRIC RANK
12.9%
UNEMPLOYMENT AMONG AGES 20 TO 24 YEARS
0.0/ 100
METRIC RATING
319th/ 347
METRIC RANK
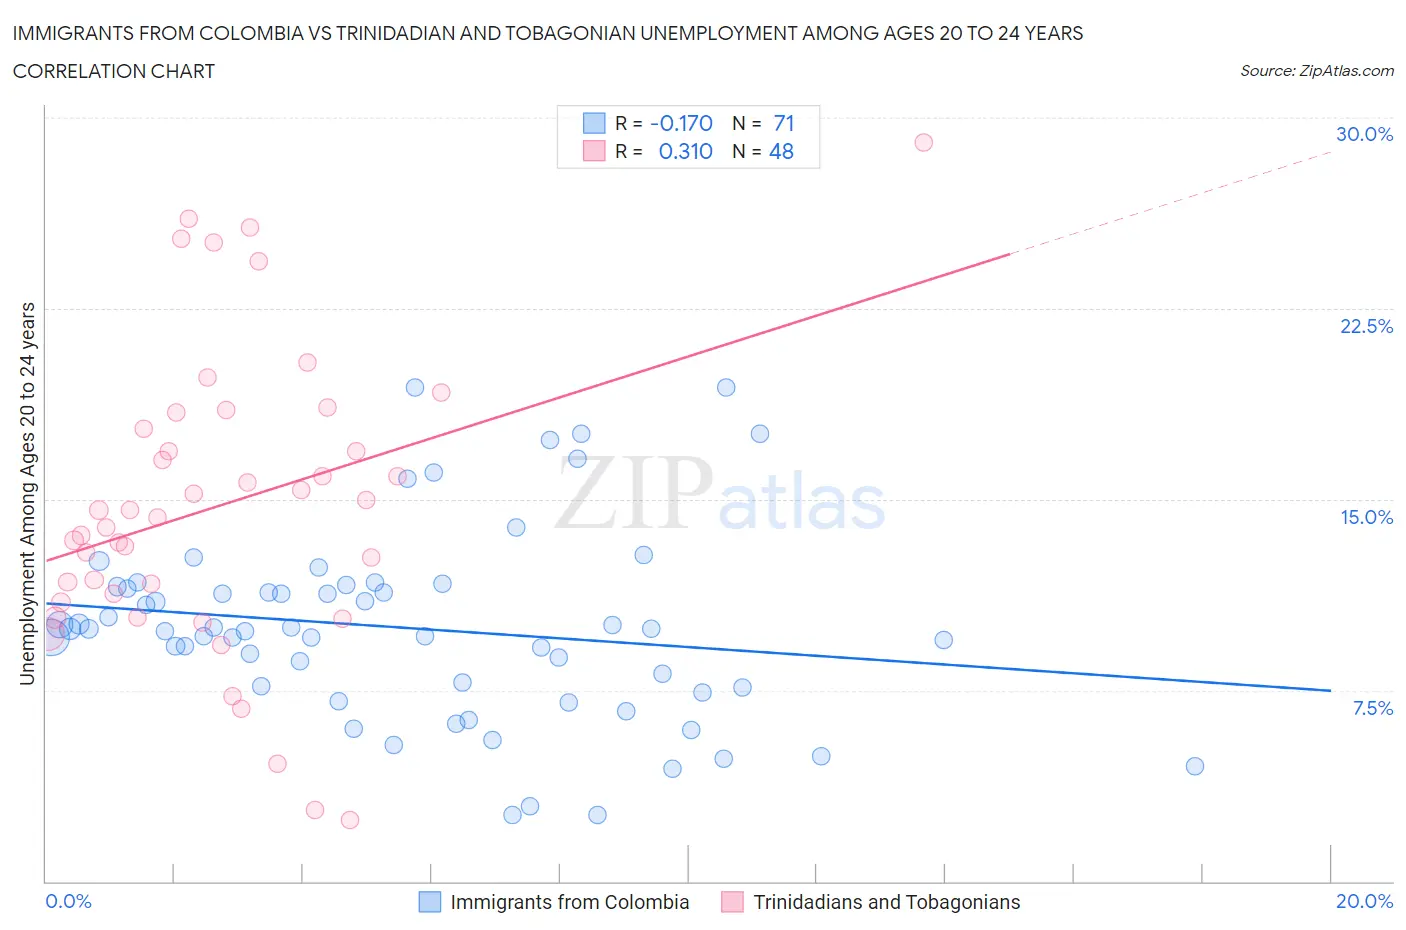
Immigrants from Colombia vs Trinidadian and Tobagonian Unemployment Among Ages 20 to 24 years Correlation Chart
The statistical analysis conducted on geographies consisting of 369,036,821 people shows a poor negative correlation between the proportion of Immigrants from Colombia and unemployment rate among population between the ages 20 and 24 in the United States with a correlation coefficient (R) of -0.170 and weighted average of 10.3%. Similarly, the statistical analysis conducted on geographies consisting of 216,876,201 people shows a mild positive correlation between the proportion of Trinidadians and Tobagonians and unemployment rate among population between the ages 20 and 24 in the United States with a correlation coefficient (R) of 0.310 and weighted average of 12.9%, a difference of 25.5%.
Unemployment Among Ages 20 to 24 years Correlation Summary
| Measurement | Immigrants from Colombia | Trinidadian and Tobagonian |
| Minimum | 2.6% | 2.4% |
| Maximum | 19.4% | 29.0% |
| Range | 16.8% | 26.6% |
| Mean | 9.9% | 14.8% |
| Median | 9.9% | 14.4% |
| Interquartile 25% (IQ1) | 7.6% | 11.1% |
| Interquartile 75% (IQ3) | 11.6% | 18.1% |
| Interquartile Range (IQR) | 4.0% | 6.9% |
| Standard Deviation (Sample) | 3.7% | 5.9% |
| Standard Deviation (Population) | 3.7% | 5.8% |
Similar Demographics by Unemployment Among Ages 20 to 24 years
Demographics Similar to Immigrants from Colombia by Unemployment Among Ages 20 to 24 years
In terms of unemployment among ages 20 to 24 years, the demographic groups most similar to Immigrants from Colombia are Iraqi (10.3%, a difference of 0.020%), Turkish (10.3%, a difference of 0.040%), Italian (10.3%, a difference of 0.050%), Immigrants from Fiji (10.3%, a difference of 0.050%), and Lebanese (10.3%, a difference of 0.070%).
| Demographics | Rating | Rank | Unemployment Among Ages 20 to 24 years |
| Immigrants | Asia | 61.3 /100 | #162 | Good 10.3% |
| Estonians | 61.1 /100 | #163 | Good 10.3% |
| Immigrants | Korea | 59.0 /100 | #164 | Average 10.3% |
| Lebanese | 58.3 /100 | #165 | Average 10.3% |
| Italians | 57.7 /100 | #166 | Average 10.3% |
| Immigrants | Fiji | 57.6 /100 | #167 | Average 10.3% |
| Iraqis | 56.7 /100 | #168 | Average 10.3% |
| Immigrants | Colombia | 56.3 /100 | #169 | Average 10.3% |
| Turks | 55.2 /100 | #170 | Average 10.3% |
| Immigrants | Eastern Asia | 52.7 /100 | #171 | Average 10.3% |
| Koreans | 51.9 /100 | #172 | Average 10.3% |
| Immigrants | Sweden | 50.8 /100 | #173 | Average 10.3% |
| Ukrainians | 50.0 /100 | #174 | Average 10.3% |
| Samoans | 45.4 /100 | #175 | Average 10.3% |
| Potawatomi | 42.0 /100 | #176 | Average 10.3% |
Demographics Similar to Trinidadians and Tobagonians by Unemployment Among Ages 20 to 24 years
In terms of unemployment among ages 20 to 24 years, the demographic groups most similar to Trinidadians and Tobagonians are Barbadian (12.9%, a difference of 0.25%), Cheyenne (13.0%, a difference of 0.42%), Immigrants from Trinidad and Tobago (12.8%, a difference of 0.51%), Immigrants from Jamaica (13.0%, a difference of 0.51%), and Immigrants from Dominica (12.8%, a difference of 0.63%).
| Demographics | Rating | Rank | Unemployment Among Ages 20 to 24 years |
| Houma | 0.0 /100 | #312 | Tragic 12.6% |
| Shoshone | 0.0 /100 | #313 | Tragic 12.7% |
| Blacks/African Americans | 0.0 /100 | #314 | Tragic 12.7% |
| West Indians | 0.0 /100 | #315 | Tragic 12.8% |
| Immigrants | Dominica | 0.0 /100 | #316 | Tragic 12.8% |
| Immigrants | Trinidad and Tobago | 0.0 /100 | #317 | Tragic 12.8% |
| Barbadians | 0.0 /100 | #318 | Tragic 12.9% |
| Trinidadians and Tobagonians | 0.0 /100 | #319 | Tragic 12.9% |
| Cheyenne | 0.0 /100 | #320 | Tragic 13.0% |
| Immigrants | Jamaica | 0.0 /100 | #321 | Tragic 13.0% |
| Natives/Alaskans | 0.0 /100 | #322 | Tragic 13.0% |
| Yakama | 0.0 /100 | #323 | Tragic 13.1% |
| Alaska Natives | 0.0 /100 | #324 | Tragic 13.2% |
| Pueblo | 0.0 /100 | #325 | Tragic 13.2% |
| Immigrants | Barbados | 0.0 /100 | #326 | Tragic 13.5% |