Immigrants from Colombia vs Trinidadian and Tobagonian Seniors Poverty Over the Age of 75
COMPARE
Immigrants from Colombia
Trinidadian and Tobagonian
Seniors Poverty Over the Age of 75
Seniors Poverty Over the Age of 75 Comparison
Immigrants from Colombia
Trinidadians and Tobagonians
14.6%
SENIORS POVERTY OVER THE AGE OF 75
0.0/ 100
METRIC RATING
278th/ 347
METRIC RANK
15.9%
SENIORS POVERTY OVER THE AGE OF 75
0.0/ 100
METRIC RATING
311th/ 347
METRIC RANK
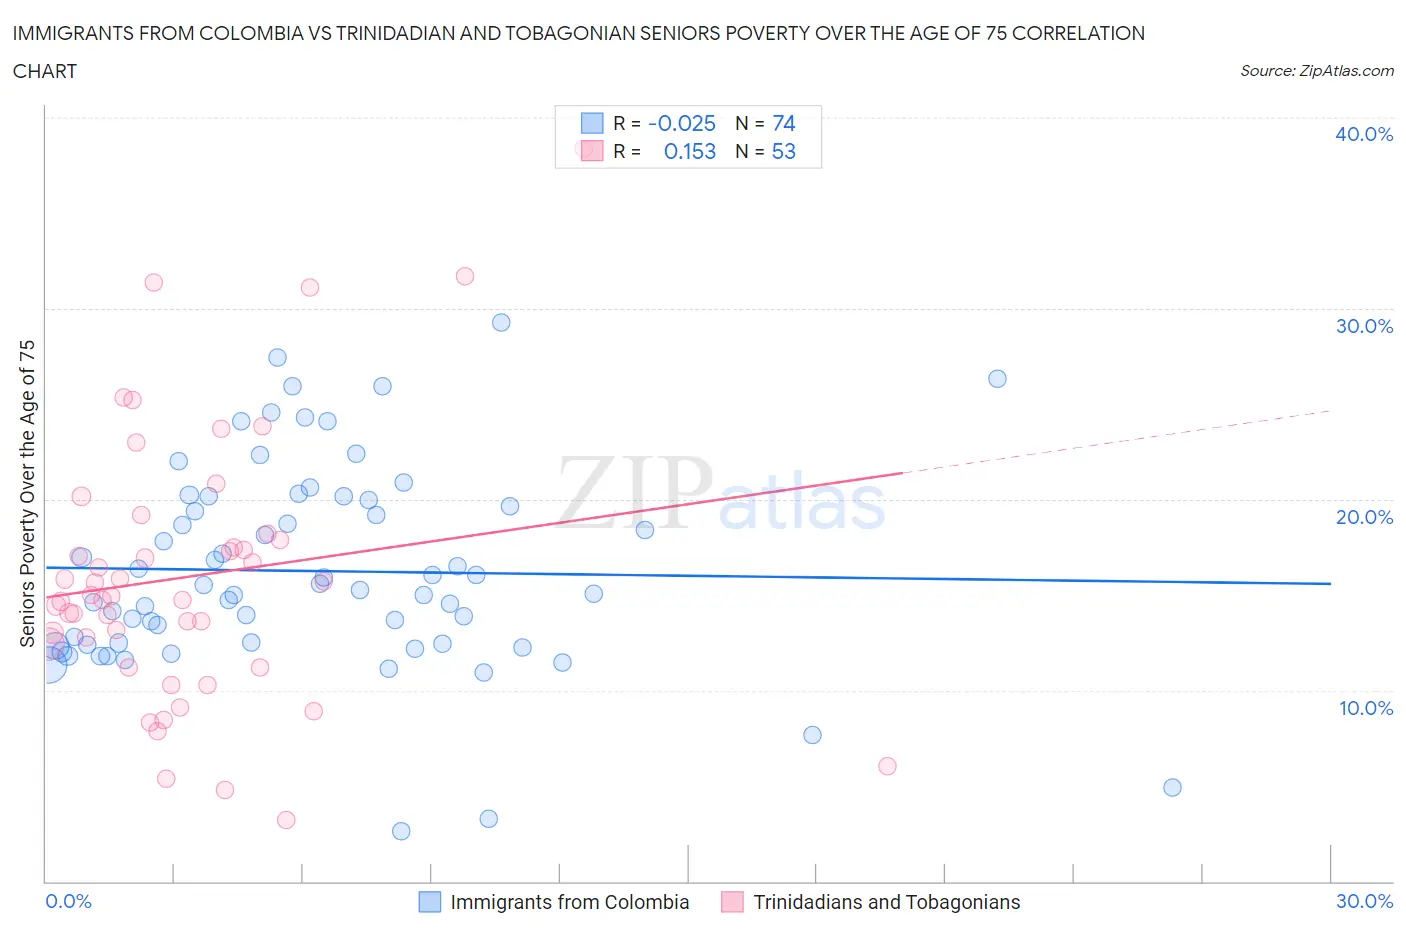
Immigrants from Colombia vs Trinidadian and Tobagonian Seniors Poverty Over the Age of 75 Correlation Chart
The statistical analysis conducted on geographies consisting of 374,797,276 people shows no correlation between the proportion of Immigrants from Colombia and poverty level among seniors over the age of 75 in the United States with a correlation coefficient (R) of -0.025 and weighted average of 14.6%. Similarly, the statistical analysis conducted on geographies consisting of 218,354,994 people shows a poor positive correlation between the proportion of Trinidadians and Tobagonians and poverty level among seniors over the age of 75 in the United States with a correlation coefficient (R) of 0.153 and weighted average of 15.9%, a difference of 8.6%.
Seniors Poverty Over the Age of 75 Correlation Summary
| Measurement | Immigrants from Colombia | Trinidadian and Tobagonian |
| Minimum | 2.6% | 3.2% |
| Maximum | 29.3% | 38.3% |
| Range | 26.6% | 35.1% |
| Mean | 16.2% | 16.0% |
| Median | 15.4% | 14.9% |
| Interquartile 25% (IQ1) | 12.4% | 11.8% |
| Interquartile 75% (IQ3) | 20.0% | 18.0% |
| Interquartile Range (IQR) | 7.6% | 6.2% |
| Standard Deviation (Sample) | 5.3% | 7.0% |
| Standard Deviation (Population) | 5.3% | 7.0% |
Similar Demographics by Seniors Poverty Over the Age of 75
Demographics Similar to Immigrants from Colombia by Seniors Poverty Over the Age of 75
In terms of seniors poverty over the age of 75, the demographic groups most similar to Immigrants from Colombia are Black/African American (14.6%, a difference of 0.21%), Senegalese (14.5%, a difference of 0.77%), Central American (14.7%, a difference of 0.85%), Belizean (14.8%, a difference of 0.97%), and Soviet Union (14.5%, a difference of 1.1%).
| Demographics | Rating | Rank | Seniors Poverty Over the Age of 75 |
| Immigrants | Ghana | 0.0 /100 | #271 | Tragic 14.4% |
| Mexicans | 0.0 /100 | #272 | Tragic 14.4% |
| Immigrants | South America | 0.0 /100 | #273 | Tragic 14.4% |
| Immigrants | Bahamas | 0.0 /100 | #274 | Tragic 14.4% |
| Immigrants | El Salvador | 0.0 /100 | #275 | Tragic 14.5% |
| Soviet Union | 0.0 /100 | #276 | Tragic 14.5% |
| Senegalese | 0.0 /100 | #277 | Tragic 14.5% |
| Immigrants | Colombia | 0.0 /100 | #278 | Tragic 14.6% |
| Blacks/African Americans | 0.0 /100 | #279 | Tragic 14.6% |
| Central Americans | 0.0 /100 | #280 | Tragic 14.7% |
| Belizeans | 0.0 /100 | #281 | Tragic 14.8% |
| Immigrants | Senegal | 0.0 /100 | #282 | Tragic 14.8% |
| Guatemalans | 0.0 /100 | #283 | Tragic 14.8% |
| Cheyenne | 0.0 /100 | #284 | Tragic 14.9% |
| Immigrants | Mexico | 0.0 /100 | #285 | Tragic 14.9% |
Demographics Similar to Trinidadians and Tobagonians by Seniors Poverty Over the Age of 75
In terms of seniors poverty over the age of 75, the demographic groups most similar to Trinidadians and Tobagonians are Vietnamese (15.9%, a difference of 0.10%), Yup'ik (15.8%, a difference of 0.20%), Crow (15.9%, a difference of 0.41%), Immigrants from Bangladesh (15.8%, a difference of 0.50%), and Immigrants from West Indies (15.8%, a difference of 0.55%).
| Demographics | Rating | Rank | Seniors Poverty Over the Age of 75 |
| Immigrants | Trinidad and Tobago | 0.0 /100 | #304 | Tragic 15.7% |
| Ecuadorians | 0.0 /100 | #305 | Tragic 15.7% |
| Hispanics or Latinos | 0.0 /100 | #306 | Tragic 15.8% |
| Immigrants | West Indies | 0.0 /100 | #307 | Tragic 15.8% |
| Immigrants | Bangladesh | 0.0 /100 | #308 | Tragic 15.8% |
| Yup'ik | 0.0 /100 | #309 | Tragic 15.8% |
| Vietnamese | 0.0 /100 | #310 | Tragic 15.9% |
| Trinidadians and Tobagonians | 0.0 /100 | #311 | Tragic 15.9% |
| Crow | 0.0 /100 | #312 | Tragic 15.9% |
| Barbadians | 0.0 /100 | #313 | Tragic 16.0% |
| Tsimshian | 0.0 /100 | #314 | Tragic 16.1% |
| Guyanese | 0.0 /100 | #315 | Tragic 16.1% |
| Immigrants | Ecuador | 0.0 /100 | #316 | Tragic 16.1% |
| Immigrants | Guyana | 0.0 /100 | #317 | Tragic 16.2% |
| Houma | 0.0 /100 | #318 | Tragic 16.2% |