Immigrants from Colombia vs Trinidadian and Tobagonian 6th Grade
COMPARE
Immigrants from Colombia
Trinidadian and Tobagonian
6th Grade
6th Grade Comparison
Immigrants from Colombia
Trinidadians and Tobagonians
96.4%
6TH GRADE
0.3/ 100
METRIC RATING
263rd/ 347
METRIC RANK
96.2%
6TH GRADE
0.1/ 100
METRIC RATING
281st/ 347
METRIC RANK
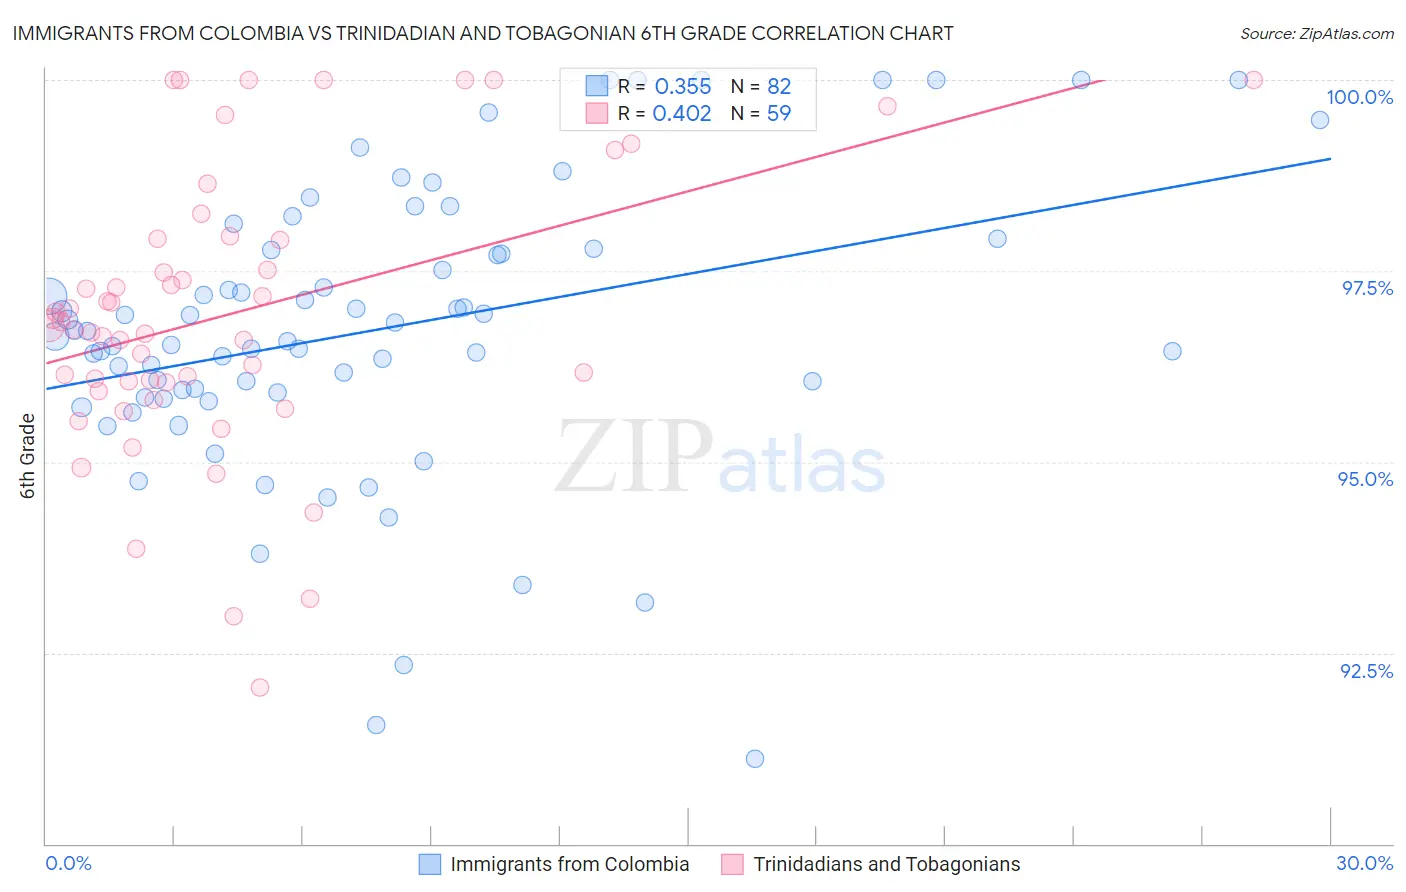
Immigrants from Colombia vs Trinidadian and Tobagonian 6th Grade Correlation Chart
The statistical analysis conducted on geographies consisting of 378,598,469 people shows a mild positive correlation between the proportion of Immigrants from Colombia and percentage of population with at least 6th grade education in the United States with a correlation coefficient (R) of 0.355 and weighted average of 96.4%. Similarly, the statistical analysis conducted on geographies consisting of 219,882,819 people shows a moderate positive correlation between the proportion of Trinidadians and Tobagonians and percentage of population with at least 6th grade education in the United States with a correlation coefficient (R) of 0.402 and weighted average of 96.2%, a difference of 0.15%.
6th Grade Correlation Summary
| Measurement | Immigrants from Colombia | Trinidadian and Tobagonian |
| Minimum | 91.1% | 92.1% |
| Maximum | 100.0% | 100.0% |
| Range | 8.9% | 7.9% |
| Mean | 96.7% | 96.9% |
| Median | 96.7% | 96.8% |
| Interquartile 25% (IQ1) | 95.9% | 96.0% |
| Interquartile 75% (IQ3) | 97.8% | 97.9% |
| Interquartile Range (IQR) | 1.9% | 1.9% |
| Standard Deviation (Sample) | 1.9% | 1.8% |
| Standard Deviation (Population) | 1.8% | 1.8% |
Demographics Similar to Immigrants from Colombia and Trinidadians and Tobagonians by 6th Grade
In terms of 6th grade, the demographic groups most similar to Immigrants from Colombia are Armenian (96.4%, a difference of 0.0%), Immigrants from Nigeria (96.4%, a difference of 0.010%), Immigrants from Jamaica (96.4%, a difference of 0.010%), Ghanaian (96.4%, a difference of 0.020%), and Afghan (96.4%, a difference of 0.020%). Similarly, the demographic groups most similar to Trinidadians and Tobagonians are Immigrants from Peru (96.2%, a difference of 0.0%), Immigrants from Afghanistan (96.2%, a difference of 0.0%), Houma (96.2%, a difference of 0.0%), Immigrants from Western Africa (96.3%, a difference of 0.020%), and Immigrants from Thailand (96.3%, a difference of 0.020%).
| Demographics | Rating | Rank | 6th Grade |
| Immigrants | Nigeria | 0.3 /100 | #262 | Tragic 96.4% |
| Immigrants | Colombia | 0.3 /100 | #263 | Tragic 96.4% |
| Armenians | 0.3 /100 | #264 | Tragic 96.4% |
| Immigrants | Jamaica | 0.2 /100 | #265 | Tragic 96.4% |
| Ghanaians | 0.2 /100 | #266 | Tragic 96.4% |
| Afghans | 0.2 /100 | #267 | Tragic 96.4% |
| Immigrants | Uzbekistan | 0.2 /100 | #268 | Tragic 96.3% |
| West Indians | 0.2 /100 | #269 | Tragic 96.3% |
| Immigrants | South America | 0.2 /100 | #270 | Tragic 96.3% |
| Immigrants | Hong Kong | 0.2 /100 | #271 | Tragic 96.3% |
| Immigrants | Bolivia | 0.1 /100 | #272 | Tragic 96.3% |
| Immigrants | Cameroon | 0.1 /100 | #273 | Tragic 96.3% |
| Immigrants | Philippines | 0.1 /100 | #274 | Tragic 96.3% |
| Immigrants | Ghana | 0.1 /100 | #275 | Tragic 96.3% |
| Yaqui | 0.1 /100 | #276 | Tragic 96.3% |
| Immigrants | Western Africa | 0.1 /100 | #277 | Tragic 96.3% |
| Immigrants | Thailand | 0.1 /100 | #278 | Tragic 96.3% |
| Immigrants | Peru | 0.1 /100 | #279 | Tragic 96.2% |
| Immigrants | Afghanistan | 0.1 /100 | #280 | Tragic 96.2% |
| Trinidadians and Tobagonians | 0.1 /100 | #281 | Tragic 96.2% |
| Houma | 0.1 /100 | #282 | Tragic 96.2% |