Immigrants from Ecuador vs Immigrants from Honduras Poverty
COMPARE
Immigrants from Ecuador
Immigrants from Honduras
Poverty
Poverty Comparison
Immigrants from Ecuador
Immigrants from Honduras
14.3%
POVERTY
0.1/ 100
METRIC RATING
255th/ 347
METRIC RANK
16.2%
POVERTY
0.0/ 100
METRIC RATING
320th/ 347
METRIC RANK
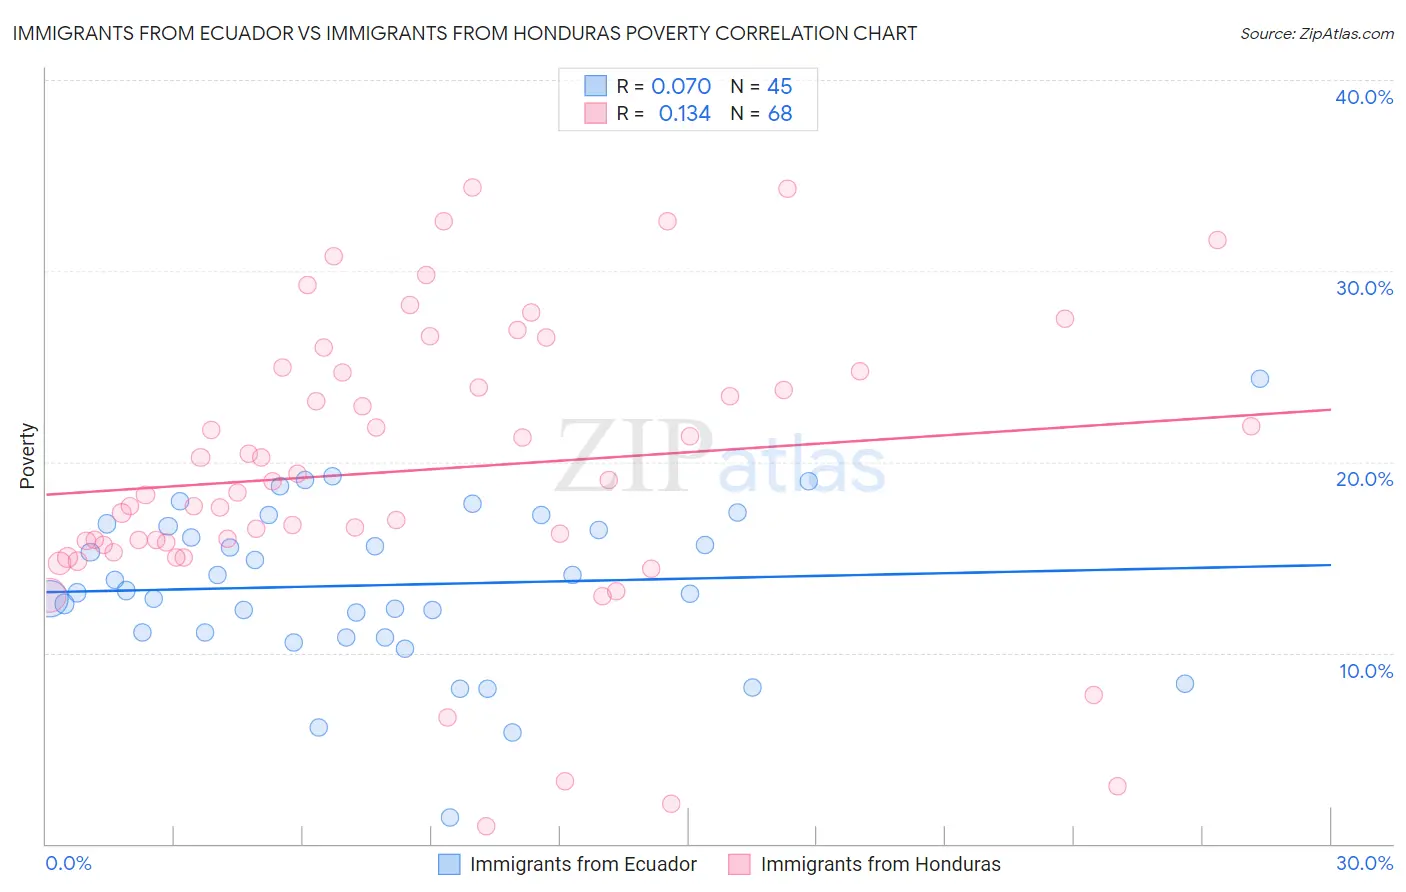
Immigrants from Ecuador vs Immigrants from Honduras Poverty Correlation Chart
The statistical analysis conducted on geographies consisting of 270,887,290 people shows a slight positive correlation between the proportion of Immigrants from Ecuador and poverty level in the United States with a correlation coefficient (R) of 0.070 and weighted average of 14.3%. Similarly, the statistical analysis conducted on geographies consisting of 322,477,641 people shows a poor positive correlation between the proportion of Immigrants from Honduras and poverty level in the United States with a correlation coefficient (R) of 0.134 and weighted average of 16.2%, a difference of 13.1%.
Poverty Correlation Summary
| Measurement | Immigrants from Ecuador | Immigrants from Honduras |
| Minimum | 1.4% | 0.89% |
| Maximum | 24.4% | 34.4% |
| Range | 23.0% | 33.5% |
| Mean | 13.6% | 19.6% |
| Median | 13.3% | 18.7% |
| Interquartile 25% (IQ1) | 10.9% | 15.7% |
| Interquartile 75% (IQ3) | 16.7% | 24.7% |
| Interquartile Range (IQR) | 5.8% | 9.0% |
| Standard Deviation (Sample) | 4.3% | 7.5% |
| Standard Deviation (Population) | 4.2% | 7.4% |
Similar Demographics by Poverty
Demographics Similar to Immigrants from Ecuador by Poverty
In terms of poverty, the demographic groups most similar to Immigrants from Ecuador are Mexican American Indian (14.3%, a difference of 0.020%), Trinidadian and Tobagonian (14.3%, a difference of 0.060%), Ottawa (14.3%, a difference of 0.070%), Immigrants from El Salvador (14.3%, a difference of 0.10%), and Immigrants from Nicaragua (14.3%, a difference of 0.34%).
| Demographics | Rating | Rank | Poverty |
| Immigrants | Western Africa | 0.2 /100 | #248 | Tragic 14.1% |
| Immigrants | Ghana | 0.2 /100 | #249 | Tragic 14.2% |
| Cree | 0.2 /100 | #250 | Tragic 14.2% |
| Immigrants | Burma/Myanmar | 0.2 /100 | #251 | Tragic 14.2% |
| Spanish American Indians | 0.2 /100 | #252 | Tragic 14.2% |
| Immigrants | Trinidad and Tobago | 0.2 /100 | #253 | Tragic 14.2% |
| Immigrants | El Salvador | 0.1 /100 | #254 | Tragic 14.3% |
| Immigrants | Ecuador | 0.1 /100 | #255 | Tragic 14.3% |
| Mexican American Indians | 0.1 /100 | #256 | Tragic 14.3% |
| Trinidadians and Tobagonians | 0.1 /100 | #257 | Tragic 14.3% |
| Ottawa | 0.1 /100 | #258 | Tragic 14.3% |
| Immigrants | Nicaragua | 0.1 /100 | #259 | Tragic 14.3% |
| Cape Verdeans | 0.1 /100 | #260 | Tragic 14.4% |
| Cherokee | 0.1 /100 | #261 | Tragic 14.4% |
| Immigrants | Liberia | 0.1 /100 | #262 | Tragic 14.4% |
Demographics Similar to Immigrants from Honduras by Poverty
In terms of poverty, the demographic groups most similar to Immigrants from Honduras are Immigrants from Congo (16.1%, a difference of 0.23%), Immigrants from Dominica (16.1%, a difference of 0.43%), U.S. Virgin Islander (16.1%, a difference of 0.72%), Arapaho (16.3%, a difference of 0.74%), and Menominee (16.4%, a difference of 1.7%).
| Demographics | Rating | Rank | Poverty |
| Immigrants | Grenada | 0.0 /100 | #313 | Tragic 15.8% |
| Immigrants | Somalia | 0.0 /100 | #314 | Tragic 15.8% |
| British West Indians | 0.0 /100 | #315 | Tragic 15.9% |
| Hondurans | 0.0 /100 | #316 | Tragic 15.9% |
| U.S. Virgin Islanders | 0.0 /100 | #317 | Tragic 16.1% |
| Immigrants | Dominica | 0.0 /100 | #318 | Tragic 16.1% |
| Immigrants | Congo | 0.0 /100 | #319 | Tragic 16.1% |
| Immigrants | Honduras | 0.0 /100 | #320 | Tragic 16.2% |
| Arapaho | 0.0 /100 | #321 | Tragic 16.3% |
| Menominee | 0.0 /100 | #322 | Tragic 16.4% |
| Colville | 0.0 /100 | #323 | Tragic 16.6% |
| Yakama | 0.0 /100 | #324 | Tragic 16.7% |
| Central American Indians | 0.0 /100 | #325 | Tragic 16.7% |
| Paiute | 0.0 /100 | #326 | Tragic 16.7% |
| Kiowa | 0.0 /100 | #327 | Tragic 16.8% |