Immigrants from Caribbean vs English Single Male Poverty
COMPARE
Immigrants from Caribbean
English
Single Male Poverty
Single Male Poverty Comparison
Immigrants from Caribbean
English
13.3%
SINGLE MALE POVERTY
5.0/ 100
METRIC RATING
232nd/ 347
METRIC RANK
14.1%
SINGLE MALE POVERTY
0.1/ 100
METRIC RATING
275th/ 347
METRIC RANK
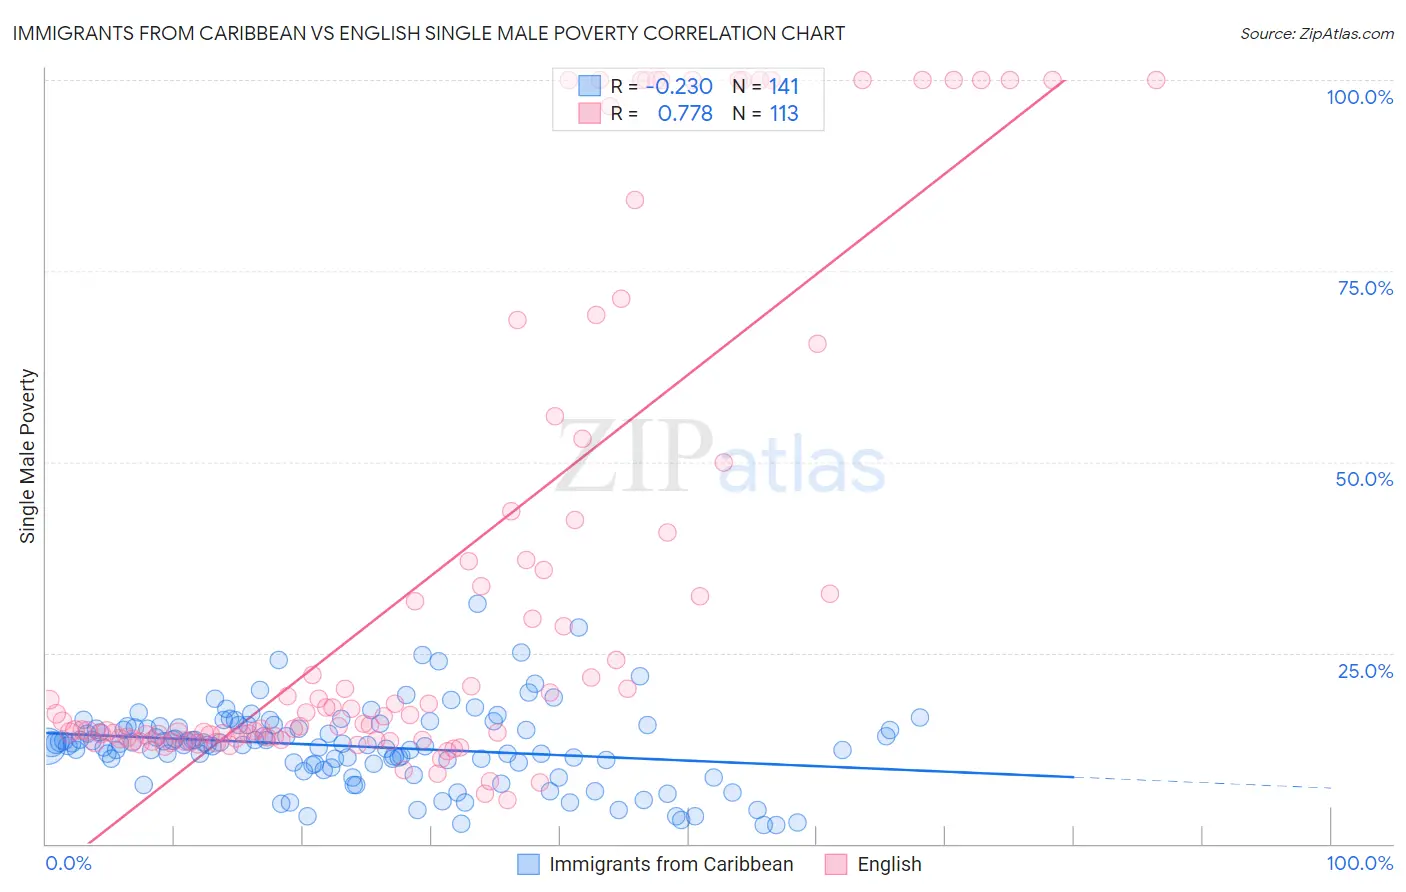
Immigrants from Caribbean vs English Single Male Poverty Correlation Chart
The statistical analysis conducted on geographies consisting of 393,892,998 people shows a weak negative correlation between the proportion of Immigrants from Caribbean and poverty level among single males in the United States with a correlation coefficient (R) of -0.230 and weighted average of 13.3%. Similarly, the statistical analysis conducted on geographies consisting of 475,099,877 people shows a strong positive correlation between the proportion of English and poverty level among single males in the United States with a correlation coefficient (R) of 0.778 and weighted average of 14.1%, a difference of 5.8%.
Single Male Poverty Correlation Summary
| Measurement | Immigrants from Caribbean | English |
| Minimum | 2.4% | 5.8% |
| Maximum | 31.5% | 100.0% |
| Range | 29.0% | 94.2% |
| Mean | 12.8% | 34.8% |
| Median | 13.0% | 16.8% |
| Interquartile 25% (IQ1) | 10.5% | 13.9% |
| Interquartile 75% (IQ3) | 15.4% | 43.0% |
| Interquartile Range (IQR) | 4.9% | 29.1% |
| Standard Deviation (Sample) | 5.1% | 32.6% |
| Standard Deviation (Population) | 5.1% | 32.5% |
Similar Demographics by Single Male Poverty
Demographics Similar to Immigrants from Caribbean by Single Male Poverty
In terms of single male poverty, the demographic groups most similar to Immigrants from Caribbean are Slavic (13.3%, a difference of 0.090%), Ghanaian (13.3%, a difference of 0.27%), British (13.3%, a difference of 0.29%), Canadian (13.3%, a difference of 0.29%), and European (13.3%, a difference of 0.30%).
| Demographics | Rating | Rank | Single Male Poverty |
| Immigrants | Denmark | 8.7 /100 | #225 | Tragic 13.2% |
| Jamaicans | 7.7 /100 | #226 | Tragic 13.2% |
| Haitians | 7.0 /100 | #227 | Tragic 13.2% |
| Lebanese | 6.6 /100 | #228 | Tragic 13.2% |
| Europeans | 6.2 /100 | #229 | Tragic 13.3% |
| Ghanaians | 6.1 /100 | #230 | Tragic 13.3% |
| Slavs | 5.3 /100 | #231 | Tragic 13.3% |
| Immigrants | Caribbean | 5.0 /100 | #232 | Tragic 13.3% |
| British | 4.0 /100 | #233 | Tragic 13.3% |
| Canadians | 4.0 /100 | #234 | Tragic 13.3% |
| Bangladeshis | 3.7 /100 | #235 | Tragic 13.3% |
| Luxembourgers | 3.6 /100 | #236 | Tragic 13.4% |
| British West Indians | 3.4 /100 | #237 | Tragic 13.4% |
| Immigrants | Ghana | 3.2 /100 | #238 | Tragic 13.4% |
| Czechoslovakians | 3.0 /100 | #239 | Tragic 13.4% |
Demographics Similar to English by Single Male Poverty
In terms of single male poverty, the demographic groups most similar to English are Honduran (14.0%, a difference of 0.080%), Dutch (14.1%, a difference of 0.12%), Immigrants from Honduras (14.1%, a difference of 0.16%), Welsh (14.0%, a difference of 0.21%), and Slovak (14.1%, a difference of 0.22%).
| Demographics | Rating | Rank | Single Male Poverty |
| Immigrants | Mexico | 0.1 /100 | #268 | Tragic 13.9% |
| Scottish | 0.1 /100 | #269 | Tragic 14.0% |
| Immigrants | Saudi Arabia | 0.1 /100 | #270 | Tragic 14.0% |
| Irish | 0.1 /100 | #271 | Tragic 14.0% |
| Mexicans | 0.1 /100 | #272 | Tragic 14.0% |
| Welsh | 0.1 /100 | #273 | Tragic 14.0% |
| Hondurans | 0.1 /100 | #274 | Tragic 14.0% |
| English | 0.1 /100 | #275 | Tragic 14.1% |
| Dutch | 0.1 /100 | #276 | Tragic 14.1% |
| Immigrants | Honduras | 0.0 /100 | #277 | Tragic 14.1% |
| Slovaks | 0.0 /100 | #278 | Tragic 14.1% |
| Indonesians | 0.0 /100 | #279 | Tragic 14.1% |
| Hmong | 0.0 /100 | #280 | Tragic 14.2% |
| Hispanics or Latinos | 0.0 /100 | #281 | Tragic 14.2% |
| Spanish Americans | 0.0 /100 | #282 | Tragic 14.2% |