Immigrants from Canada vs Belizean Child Poverty Among Girls Under 16
COMPARE
Immigrants from Canada
Belizean
Child Poverty Among Girls Under 16
Child Poverty Among Girls Under 16 Comparison
Immigrants from Canada
Belizeans
14.8%
CHILD POVERTY AMONG GIRLS UNDER 16
97.1/ 100
METRIC RATING
88th/ 347
METRIC RANK
20.2%
CHILD POVERTY AMONG GIRLS UNDER 16
0.0/ 100
METRIC RATING
277th/ 347
METRIC RANK
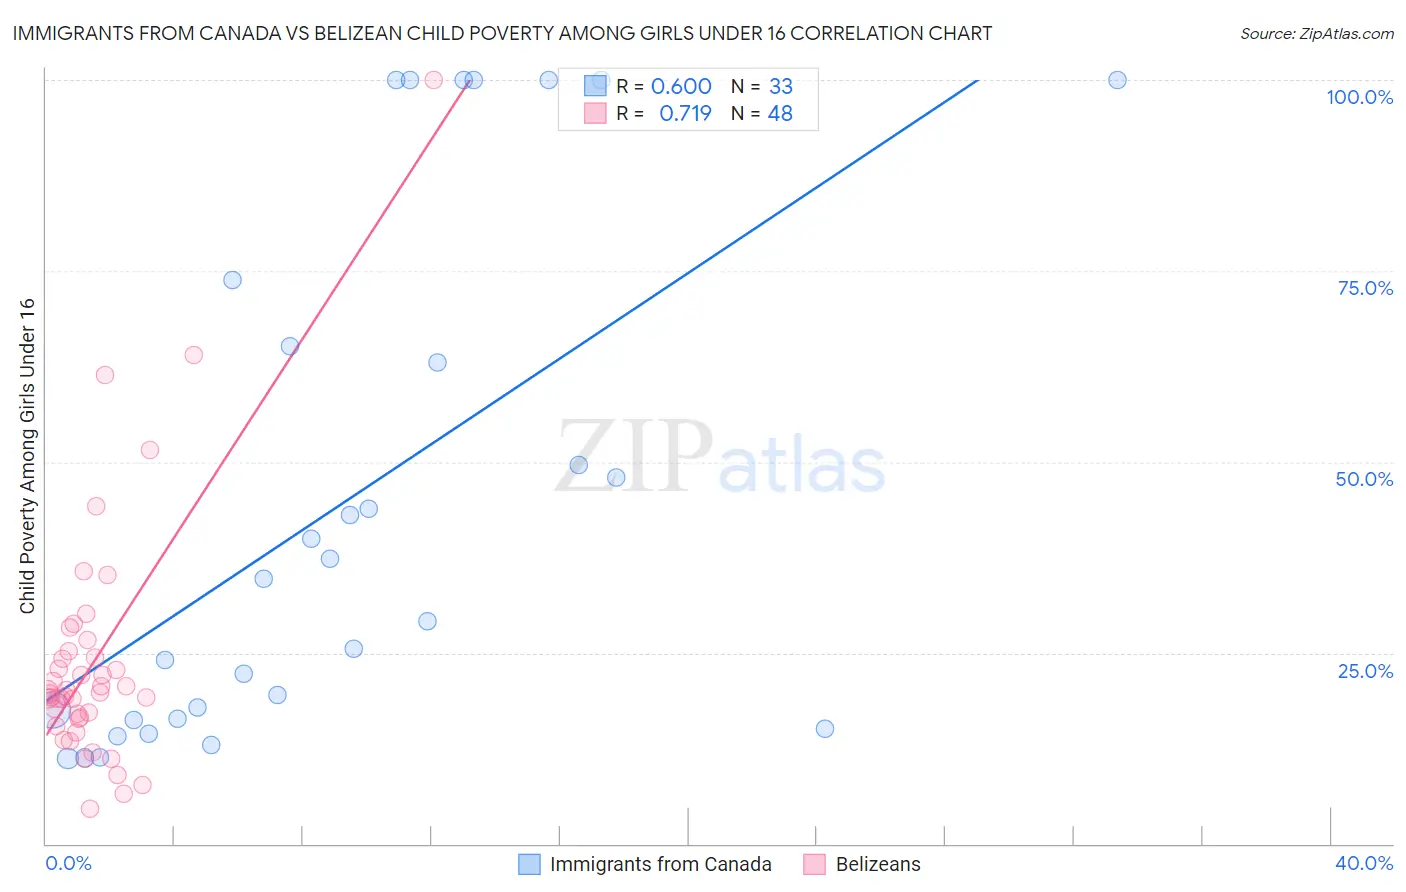
Immigrants from Canada vs Belizean Child Poverty Among Girls Under 16 Correlation Chart
The statistical analysis conducted on geographies consisting of 446,973,895 people shows a substantial positive correlation between the proportion of Immigrants from Canada and poverty level among girls under the age of 16 in the United States with a correlation coefficient (R) of 0.600 and weighted average of 14.8%. Similarly, the statistical analysis conducted on geographies consisting of 143,559,889 people shows a strong positive correlation between the proportion of Belizeans and poverty level among girls under the age of 16 in the United States with a correlation coefficient (R) of 0.719 and weighted average of 20.2%, a difference of 36.4%.
Child Poverty Among Girls Under 16 Correlation Summary
| Measurement | Immigrants from Canada | Belizean |
| Minimum | 11.2% | 4.6% |
| Maximum | 100.0% | 100.0% |
| Range | 88.8% | 95.4% |
| Mean | 44.8% | 23.9% |
| Median | 34.8% | 19.7% |
| Interquartile 25% (IQ1) | 16.3% | 16.5% |
| Interquartile 75% (IQ3) | 69.5% | 24.8% |
| Interquartile Range (IQR) | 53.2% | 8.3% |
| Standard Deviation (Sample) | 33.3% | 16.5% |
| Standard Deviation (Population) | 32.8% | 16.4% |
Similar Demographics by Child Poverty Among Girls Under 16
Demographics Similar to Immigrants from Canada by Child Poverty Among Girls Under 16
In terms of child poverty among girls under 16, the demographic groups most similar to Immigrants from Canada are Jordanian (14.8%, a difference of 0.050%), Finnish (14.8%, a difference of 0.070%), Northern European (14.8%, a difference of 0.070%), Australian (14.8%, a difference of 0.090%), and Immigrants from Belarus (14.8%, a difference of 0.11%).
| Demographics | Rating | Rank | Child Poverty Among Girls Under 16 |
| Ukrainians | 97.7 /100 | #81 | Exceptional 14.7% |
| Macedonians | 97.6 /100 | #82 | Exceptional 14.7% |
| Immigrants | Italy | 97.4 /100 | #83 | Exceptional 14.8% |
| Soviet Union | 97.3 /100 | #84 | Exceptional 14.8% |
| Swiss | 97.2 /100 | #85 | Exceptional 14.8% |
| Australians | 97.2 /100 | #86 | Exceptional 14.8% |
| Finns | 97.2 /100 | #87 | Exceptional 14.8% |
| Immigrants | Canada | 97.1 /100 | #88 | Exceptional 14.8% |
| Jordanians | 97.1 /100 | #89 | Exceptional 14.8% |
| Northern Europeans | 97.0 /100 | #90 | Exceptional 14.8% |
| Immigrants | Belarus | 97.0 /100 | #91 | Exceptional 14.8% |
| Austrians | 96.7 /100 | #92 | Exceptional 14.9% |
| Immigrants | North America | 96.6 /100 | #93 | Exceptional 14.9% |
| Immigrants | Switzerland | 96.3 /100 | #94 | Exceptional 14.9% |
| Germans | 96.3 /100 | #95 | Exceptional 14.9% |
Demographics Similar to Belizeans by Child Poverty Among Girls Under 16
In terms of child poverty among girls under 16, the demographic groups most similar to Belizeans are Barbadian (20.2%, a difference of 0.030%), Comanche (20.2%, a difference of 0.11%), Immigrants from Zaire (20.2%, a difference of 0.16%), Immigrants from Liberia (20.2%, a difference of 0.17%), and Central American (20.2%, a difference of 0.24%).
| Demographics | Rating | Rank | Child Poverty Among Girls Under 16 |
| Cherokee | 0.1 /100 | #270 | Tragic 19.9% |
| Immigrants | Barbados | 0.1 /100 | #271 | Tragic 19.9% |
| Immigrants | El Salvador | 0.1 /100 | #272 | Tragic 20.0% |
| Bangladeshis | 0.1 /100 | #273 | Tragic 20.0% |
| Immigrants | St. Vincent and the Grenadines | 0.0 /100 | #274 | Tragic 20.1% |
| Sub-Saharan Africans | 0.0 /100 | #275 | Tragic 20.1% |
| Comanche | 0.0 /100 | #276 | Tragic 20.2% |
| Belizeans | 0.0 /100 | #277 | Tragic 20.2% |
| Barbadians | 0.0 /100 | #278 | Tragic 20.2% |
| Immigrants | Zaire | 0.0 /100 | #279 | Tragic 20.2% |
| Immigrants | Liberia | 0.0 /100 | #280 | Tragic 20.2% |
| Central Americans | 0.0 /100 | #281 | Tragic 20.2% |
| West Indians | 0.0 /100 | #282 | Tragic 20.3% |
| Senegalese | 0.0 /100 | #283 | Tragic 20.3% |
| Yaqui | 0.0 /100 | #284 | Tragic 20.3% |