Immigrants from Cameroon vs Paraguayan Family Households with Children
COMPARE
Immigrants from Cameroon
Paraguayan
Family Households with Children
Family Households with Children Comparison
Immigrants from Cameroon
Paraguayans
29.2%
FAMILY HOUSEHOLDS WITH CHILDREN
100.0/ 100
METRIC RATING
37th/ 347
METRIC RANK
27.1%
FAMILY HOUSEHOLDS WITH CHILDREN
9.4/ 100
METRIC RATING
222nd/ 347
METRIC RANK
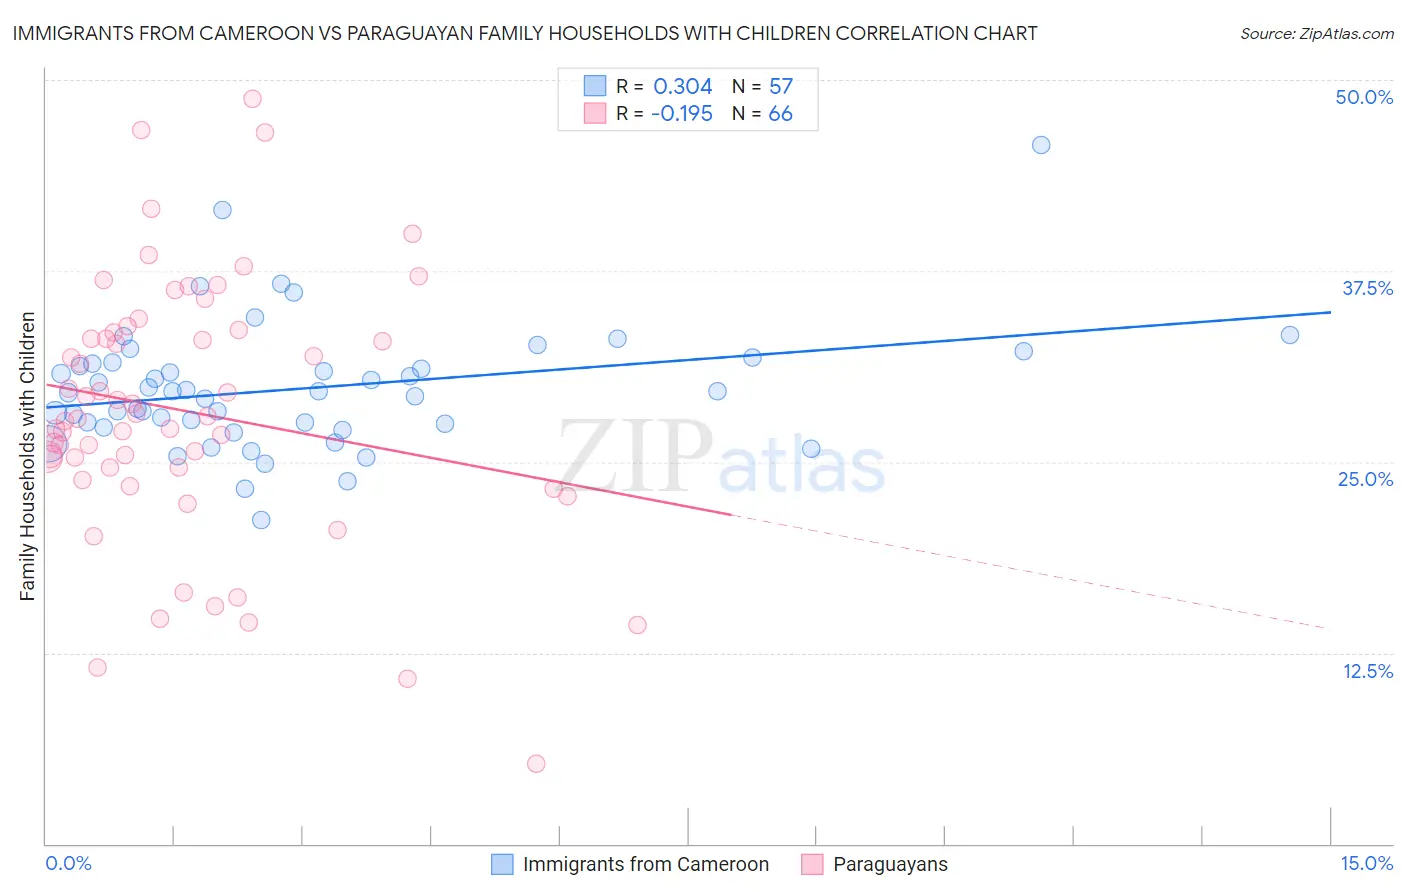
Immigrants from Cameroon vs Paraguayan Family Households with Children Correlation Chart
The statistical analysis conducted on geographies consisting of 130,728,494 people shows a mild positive correlation between the proportion of Immigrants from Cameroon and percentage of family households with children in the United States with a correlation coefficient (R) of 0.304 and weighted average of 29.2%. Similarly, the statistical analysis conducted on geographies consisting of 95,067,312 people shows a poor negative correlation between the proportion of Paraguayans and percentage of family households with children in the United States with a correlation coefficient (R) of -0.195 and weighted average of 27.1%, a difference of 7.8%.
Family Households with Children Correlation Summary
| Measurement | Immigrants from Cameroon | Paraguayan |
| Minimum | 21.2% | 5.3% |
| Maximum | 45.8% | 48.8% |
| Range | 24.6% | 43.5% |
| Mean | 29.8% | 28.3% |
| Median | 29.6% | 27.9% |
| Interquartile 25% (IQ1) | 27.4% | 24.6% |
| Interquartile 75% (IQ3) | 31.5% | 33.5% |
| Interquartile Range (IQR) | 4.1% | 8.9% |
| Standard Deviation (Sample) | 4.2% | 8.6% |
| Standard Deviation (Population) | 4.1% | 8.5% |
Similar Demographics by Family Households with Children
Demographics Similar to Immigrants from Cameroon by Family Households with Children
In terms of family households with children, the demographic groups most similar to Immigrants from Cameroon are Korean (29.2%, a difference of 0.14%), Immigrants from Venezuela (29.3%, a difference of 0.27%), Immigrants from Sierra Leone (29.3%, a difference of 0.28%), Yaqui (29.1%, a difference of 0.29%), and Central American (29.1%, a difference of 0.30%).
| Demographics | Rating | Rank | Family Households with Children |
| Yuman | 100.0 /100 | #30 | Exceptional 29.5% |
| Japanese | 100.0 /100 | #31 | Exceptional 29.4% |
| Immigrants | Yemen | 100.0 /100 | #32 | Exceptional 29.4% |
| Venezuelans | 100.0 /100 | #33 | Exceptional 29.4% |
| Immigrants | Bolivia | 100.0 /100 | #34 | Exceptional 29.3% |
| Immigrants | Sierra Leone | 100.0 /100 | #35 | Exceptional 29.3% |
| Immigrants | Venezuela | 100.0 /100 | #36 | Exceptional 29.3% |
| Immigrants | Cameroon | 100.0 /100 | #37 | Exceptional 29.2% |
| Koreans | 100.0 /100 | #38 | Exceptional 29.2% |
| Yaqui | 100.0 /100 | #39 | Exceptional 29.1% |
| Central Americans | 100.0 /100 | #40 | Exceptional 29.1% |
| Immigrants | South Eastern Asia | 100.0 /100 | #41 | Exceptional 29.1% |
| Spanish American Indians | 100.0 /100 | #42 | Exceptional 29.1% |
| Asians | 100.0 /100 | #43 | Exceptional 29.1% |
| Immigrants | Taiwan | 100.0 /100 | #44 | Exceptional 29.0% |
Demographics Similar to Paraguayans by Family Households with Children
In terms of family households with children, the demographic groups most similar to Paraguayans are New Zealander (27.1%, a difference of 0.010%), Pima (27.1%, a difference of 0.010%), Austrian (27.1%, a difference of 0.030%), German (27.1%, a difference of 0.050%), and Immigrants from Japan (27.1%, a difference of 0.080%).
| Demographics | Rating | Rank | Family Households with Children |
| Northern Europeans | 12.8 /100 | #215 | Poor 27.2% |
| Cubans | 12.2 /100 | #216 | Poor 27.1% |
| U.S. Virgin Islanders | 12.1 /100 | #217 | Poor 27.1% |
| Greeks | 11.4 /100 | #218 | Poor 27.1% |
| Immigrants | Japan | 10.7 /100 | #219 | Poor 27.1% |
| Austrians | 9.9 /100 | #220 | Tragic 27.1% |
| New Zealanders | 9.6 /100 | #221 | Tragic 27.1% |
| Paraguayans | 9.4 /100 | #222 | Tragic 27.1% |
| Pima | 9.2 /100 | #223 | Tragic 27.1% |
| Germans | 8.7 /100 | #224 | Tragic 27.1% |
| Canadians | 7.5 /100 | #225 | Tragic 27.1% |
| Czechoslovakians | 6.6 /100 | #226 | Tragic 27.0% |
| Tsimshian | 6.6 /100 | #227 | Tragic 27.0% |
| Scottish | 6.5 /100 | #228 | Tragic 27.0% |
| Immigrants | Caribbean | 6.3 /100 | #229 | Tragic 27.0% |