Immigrants from Cameroon vs Immigrants from El Salvador Family Poverty
COMPARE
Immigrants from Cameroon
Immigrants from El Salvador
Family Poverty
Family Poverty Comparison
Immigrants from Cameroon
Immigrants from El Salvador
9.0%
FAMILY POVERTY
47.1/ 100
METRIC RATING
178th/ 347
METRIC RANK
11.0%
FAMILY POVERTY
0.1/ 100
METRIC RATING
266th/ 347
METRIC RANK
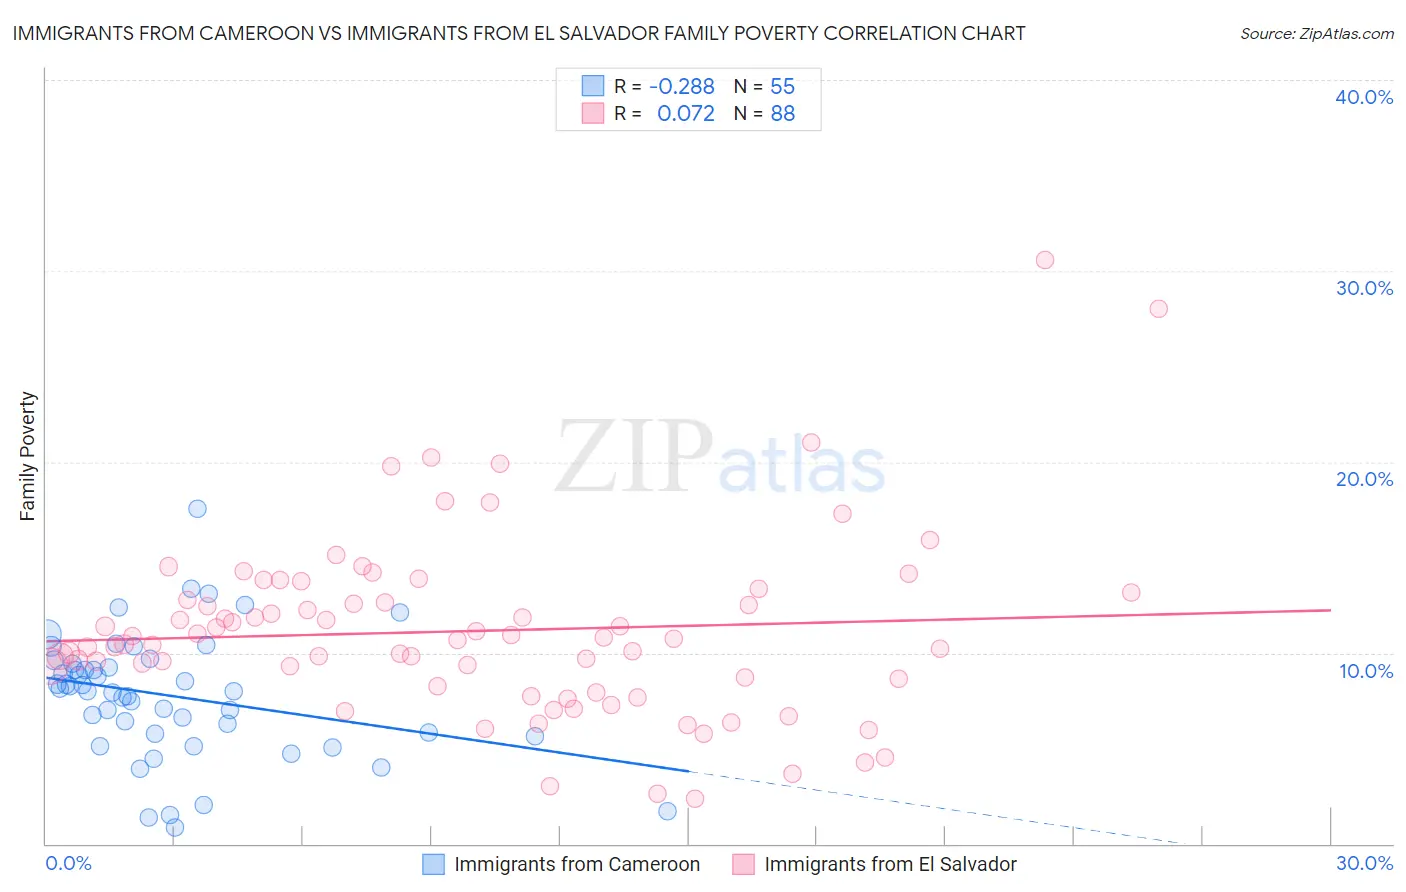
Immigrants from Cameroon vs Immigrants from El Salvador Family Poverty Correlation Chart
The statistical analysis conducted on geographies consisting of 130,510,031 people shows a weak negative correlation between the proportion of Immigrants from Cameroon and poverty level among families in the United States with a correlation coefficient (R) of -0.288 and weighted average of 9.0%. Similarly, the statistical analysis conducted on geographies consisting of 357,239,196 people shows a slight positive correlation between the proportion of Immigrants from El Salvador and poverty level among families in the United States with a correlation coefficient (R) of 0.072 and weighted average of 11.0%, a difference of 22.2%.
Family Poverty Correlation Summary
| Measurement | Immigrants from Cameroon | Immigrants from El Salvador |
| Minimum | 0.83% | 2.4% |
| Maximum | 17.5% | 30.5% |
| Range | 16.7% | 28.2% |
| Mean | 7.8% | 11.1% |
| Median | 8.0% | 10.7% |
| Interquartile 25% (IQ1) | 5.7% | 8.4% |
| Interquartile 75% (IQ3) | 9.5% | 13.0% |
| Interquartile Range (IQR) | 3.7% | 4.5% |
| Standard Deviation (Sample) | 3.2% | 4.8% |
| Standard Deviation (Population) | 3.2% | 4.7% |
Similar Demographics by Family Poverty
Demographics Similar to Immigrants from Cameroon by Family Poverty
In terms of family poverty, the demographic groups most similar to Immigrants from Cameroon are Hawaiian (9.0%, a difference of 0.010%), Immigrants from Syria (9.0%, a difference of 0.040%), Costa Rican (9.0%, a difference of 0.28%), Immigrants from Iraq (9.1%, a difference of 0.36%), and Immigrants from Albania (9.0%, a difference of 0.37%).
| Demographics | Rating | Rank | Family Poverty |
| Lebanese | 57.6 /100 | #171 | Average 8.9% |
| Immigrants | Peru | 57.5 /100 | #172 | Average 8.9% |
| Immigrants | Fiji | 56.4 /100 | #173 | Average 8.9% |
| Immigrants | Albania | 50.0 /100 | #174 | Average 9.0% |
| Costa Ricans | 49.3 /100 | #175 | Average 9.0% |
| Immigrants | Syria | 47.5 /100 | #176 | Average 9.0% |
| Hawaiians | 47.2 /100 | #177 | Average 9.0% |
| Immigrants | Cameroon | 47.1 /100 | #178 | Average 9.0% |
| Immigrants | Iraq | 44.4 /100 | #179 | Average 9.1% |
| Immigrants | Uganda | 43.4 /100 | #180 | Average 9.1% |
| Hmong | 40.2 /100 | #181 | Average 9.1% |
| Immigrants | Morocco | 40.2 /100 | #182 | Average 9.1% |
| Uruguayans | 39.2 /100 | #183 | Fair 9.1% |
| South American Indians | 38.7 /100 | #184 | Fair 9.1% |
| Immigrants | Saudi Arabia | 38.6 /100 | #185 | Fair 9.1% |
Demographics Similar to Immigrants from El Salvador by Family Poverty
In terms of family poverty, the demographic groups most similar to Immigrants from El Salvador are Comanche (11.0%, a difference of 0.010%), Jamaican (11.1%, a difference of 0.12%), Immigrants from Ecuador (11.1%, a difference of 0.60%), Immigrants from Nicaragua (11.1%, a difference of 0.60%), and Immigrants from Bahamas (11.1%, a difference of 0.85%).
| Demographics | Rating | Rank | Family Poverty |
| Mexican American Indians | 0.2 /100 | #259 | Tragic 10.9% |
| Bangladeshis | 0.2 /100 | #260 | Tragic 10.9% |
| Shoshone | 0.2 /100 | #261 | Tragic 10.9% |
| Spanish American Indians | 0.2 /100 | #262 | Tragic 10.9% |
| Cape Verdeans | 0.1 /100 | #263 | Tragic 10.9% |
| Trinidadians and Tobagonians | 0.1 /100 | #264 | Tragic 10.9% |
| Immigrants | Trinidad and Tobago | 0.1 /100 | #265 | Tragic 10.9% |
| Immigrants | El Salvador | 0.1 /100 | #266 | Tragic 11.0% |
| Comanche | 0.1 /100 | #267 | Tragic 11.0% |
| Jamaicans | 0.1 /100 | #268 | Tragic 11.1% |
| Immigrants | Ecuador | 0.1 /100 | #269 | Tragic 11.1% |
| Immigrants | Nicaragua | 0.1 /100 | #270 | Tragic 11.1% |
| Immigrants | Bahamas | 0.1 /100 | #271 | Tragic 11.1% |
| Immigrants | Jamaica | 0.1 /100 | #272 | Tragic 11.2% |
| Somalis | 0.1 /100 | #273 | Tragic 11.2% |