Immigrants from Cameroon vs Menominee Female Poverty Among 18-24 Year Olds
COMPARE
Immigrants from Cameroon
Menominee
Female Poverty Among 18-24 Year Olds
Female Poverty Among 18-24 Year Olds Comparison
Immigrants from Cameroon
Menominee
19.3%
FEMALE POVERTY AMONG 18-24 YEAR OLDS
96.3/ 100
METRIC RATING
113th/ 347
METRIC RANK
22.5%
FEMALE POVERTY AMONG 18-24 YEAR OLDS
0.0/ 100
METRIC RATING
296th/ 347
METRIC RANK
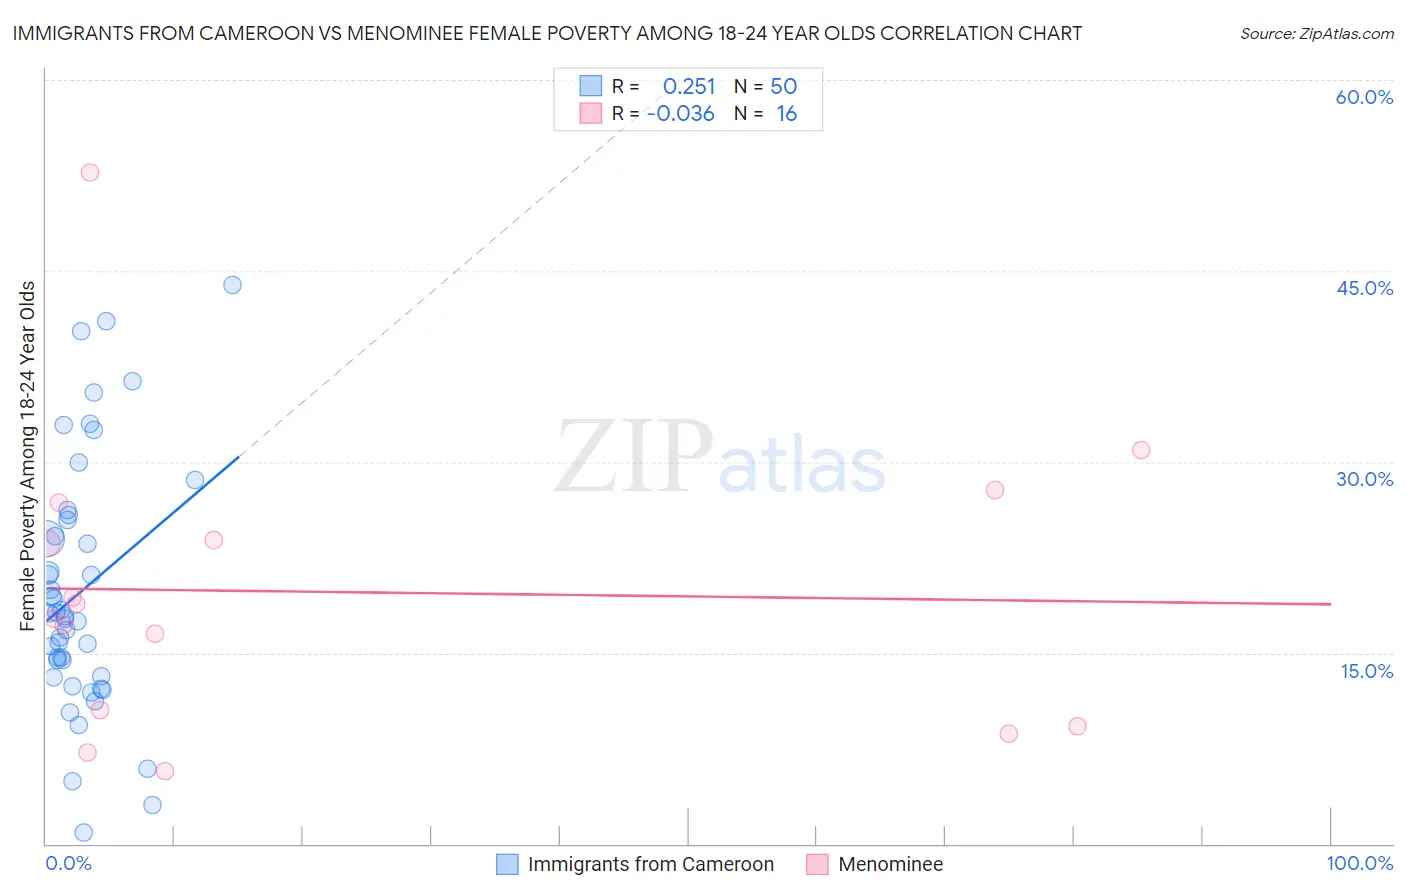
Immigrants from Cameroon vs Menominee Female Poverty Among 18-24 Year Olds Correlation Chart
The statistical analysis conducted on geographies consisting of 129,816,473 people shows a weak positive correlation between the proportion of Immigrants from Cameroon and poverty level among females between the ages 18 and 24 in the United States with a correlation coefficient (R) of 0.251 and weighted average of 19.3%. Similarly, the statistical analysis conducted on geographies consisting of 45,483,938 people shows no correlation between the proportion of Menominee and poverty level among females between the ages 18 and 24 in the United States with a correlation coefficient (R) of -0.036 and weighted average of 22.5%, a difference of 16.8%.
Female Poverty Among 18-24 Year Olds Correlation Summary
| Measurement | Immigrants from Cameroon | Menominee |
| Minimum | 0.87% | 5.7% |
| Maximum | 43.9% | 52.7% |
| Range | 43.1% | 47.0% |
| Mean | 19.8% | 19.8% |
| Median | 18.0% | 18.2% |
| Interquartile 25% (IQ1) | 13.2% | 9.9% |
| Interquartile 75% (IQ3) | 25.4% | 25.3% |
| Interquartile Range (IQR) | 12.2% | 15.4% |
| Standard Deviation (Sample) | 9.8% | 11.7% |
| Standard Deviation (Population) | 9.7% | 11.3% |
Similar Demographics by Female Poverty Among 18-24 Year Olds
Demographics Similar to Immigrants from Cameroon by Female Poverty Among 18-24 Year Olds
In terms of female poverty among 18-24 year olds, the demographic groups most similar to Immigrants from Cameroon are Slovene (19.3%, a difference of 0.040%), Immigrants from Hungary (19.3%, a difference of 0.050%), Immigrants from El Salvador (19.3%, a difference of 0.060%), Immigrants (19.3%, a difference of 0.15%), and Immigrants from Iran (19.3%, a difference of 0.19%).
| Demographics | Rating | Rank | Female Poverty Among 18-24 Year Olds |
| Immigrants | Sierra Leone | 97.8 /100 | #106 | Exceptional 19.2% |
| Immigrants | Sri Lanka | 97.5 /100 | #107 | Exceptional 19.2% |
| Immigrants | Uzbekistan | 97.3 /100 | #108 | Exceptional 19.2% |
| Immigrants | Syria | 97.2 /100 | #109 | Exceptional 19.2% |
| Laotians | 97.1 /100 | #110 | Exceptional 19.2% |
| Immigrants | Serbia | 97.1 /100 | #111 | Exceptional 19.2% |
| Immigrants | El Salvador | 96.5 /100 | #112 | Exceptional 19.3% |
| Immigrants | Cameroon | 96.3 /100 | #113 | Exceptional 19.3% |
| Slovenes | 96.2 /100 | #114 | Exceptional 19.3% |
| Immigrants | Hungary | 96.2 /100 | #115 | Exceptional 19.3% |
| Immigrants | Immigrants | 95.9 /100 | #116 | Exceptional 19.3% |
| Immigrants | Iran | 95.8 /100 | #117 | Exceptional 19.3% |
| Immigrants | Guyana | 95.6 /100 | #118 | Exceptional 19.3% |
| Cypriots | 95.5 /100 | #119 | Exceptional 19.3% |
| Immigrants | Northern Europe | 95.4 /100 | #120 | Exceptional 19.4% |
Demographics Similar to Menominee by Female Poverty Among 18-24 Year Olds
In terms of female poverty among 18-24 year olds, the demographic groups most similar to Menominee are Shoshone (22.5%, a difference of 0.11%), Inupiat (22.6%, a difference of 0.14%), Central American Indian (22.6%, a difference of 0.21%), Indonesian (22.5%, a difference of 0.23%), and U.S. Virgin Islander (22.5%, a difference of 0.26%).
| Demographics | Rating | Rank | Female Poverty Among 18-24 Year Olds |
| French American Indians | 0.0 /100 | #289 | Tragic 22.3% |
| Immigrants | Senegal | 0.0 /100 | #290 | Tragic 22.4% |
| Bangladeshis | 0.0 /100 | #291 | Tragic 22.5% |
| Alaskan Athabascans | 0.0 /100 | #292 | Tragic 22.5% |
| U.S. Virgin Islanders | 0.0 /100 | #293 | Tragic 22.5% |
| Indonesians | 0.0 /100 | #294 | Tragic 22.5% |
| Shoshone | 0.0 /100 | #295 | Tragic 22.5% |
| Menominee | 0.0 /100 | #296 | Tragic 22.5% |
| Inupiat | 0.0 /100 | #297 | Tragic 22.6% |
| Central American Indians | 0.0 /100 | #298 | Tragic 22.6% |
| Cherokee | 0.0 /100 | #299 | Tragic 22.7% |
| Africans | 0.0 /100 | #300 | Tragic 22.8% |
| Seminole | 0.0 /100 | #301 | Tragic 22.9% |
| Iroquois | 0.0 /100 | #302 | Tragic 22.9% |
| Senegalese | 0.0 /100 | #303 | Tragic 23.0% |