Cypriot vs Immigrants from Switzerland Male Poverty
COMPARE
Cypriot
Immigrants from Switzerland
Male Poverty
Male Poverty Comparison
Cypriots
Immigrants from Switzerland
9.9%
MALE POVERTY
99.2/ 100
METRIC RATING
40th/ 347
METRIC RANK
10.8%
MALE POVERTY
79.2/ 100
METRIC RATING
137th/ 347
METRIC RANK
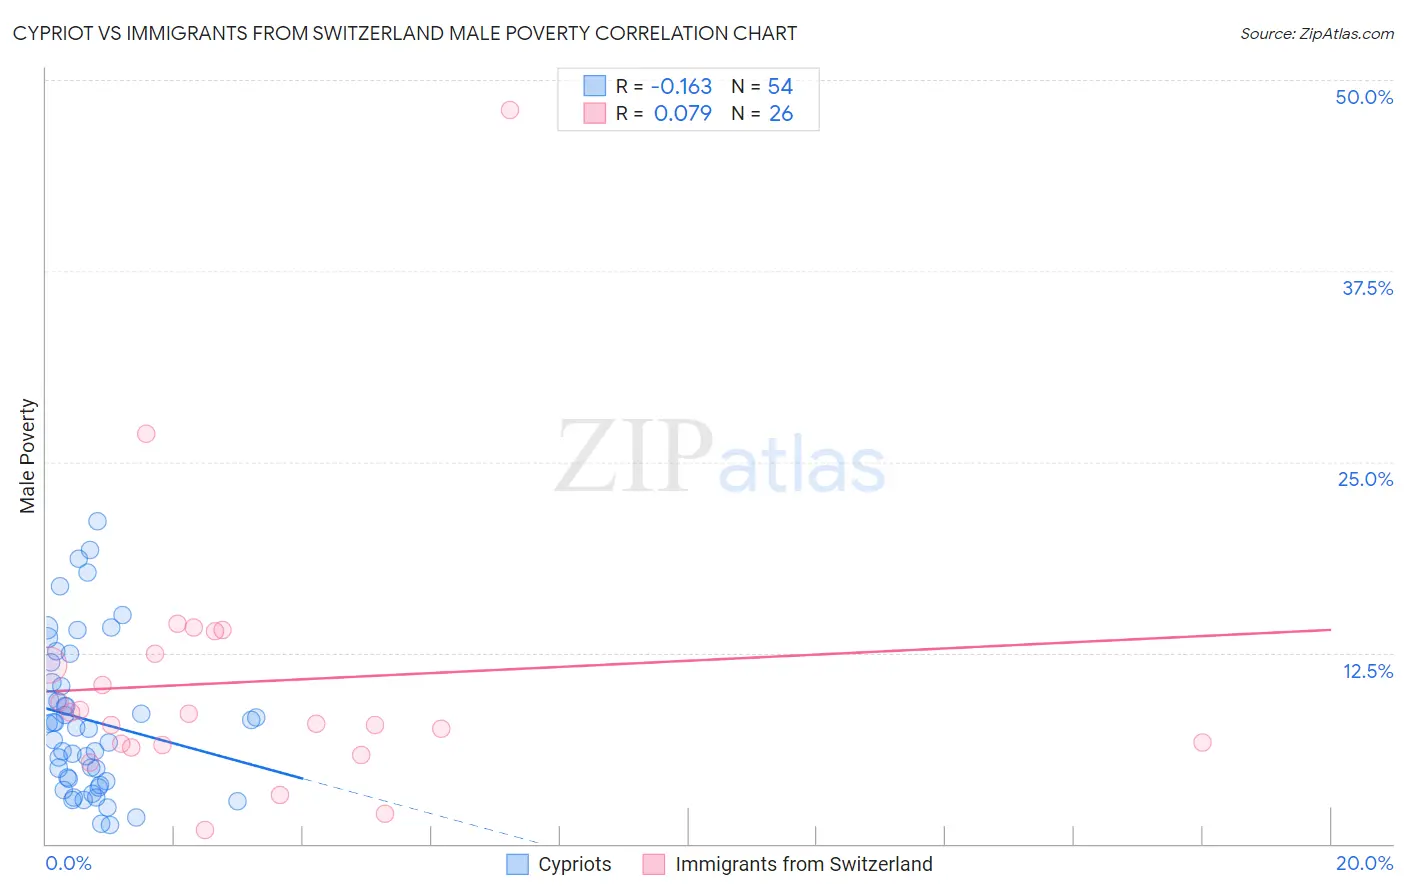
Cypriot vs Immigrants from Switzerland Male Poverty Correlation Chart
The statistical analysis conducted on geographies consisting of 61,836,468 people shows a poor negative correlation between the proportion of Cypriots and poverty level among males in the United States with a correlation coefficient (R) of -0.163 and weighted average of 9.9%. Similarly, the statistical analysis conducted on geographies consisting of 148,054,037 people shows a slight positive correlation between the proportion of Immigrants from Switzerland and poverty level among males in the United States with a correlation coefficient (R) of 0.079 and weighted average of 10.8%, a difference of 9.7%.
Male Poverty Correlation Summary
| Measurement | Cypriot | Immigrants from Switzerland |
| Minimum | 1.2% | 0.91% |
| Maximum | 21.1% | 48.0% |
| Range | 19.9% | 47.1% |
| Mean | 8.1% | 10.6% |
| Median | 7.6% | 8.2% |
| Interquartile 25% (IQ1) | 4.1% | 6.5% |
| Interquartile 75% (IQ3) | 10.5% | 12.5% |
| Interquartile Range (IQR) | 6.4% | 6.0% |
| Standard Deviation (Sample) | 5.0% | 9.2% |
| Standard Deviation (Population) | 4.9% | 9.0% |
Similar Demographics by Male Poverty
Demographics Similar to Cypriots by Male Poverty
In terms of male poverty, the demographic groups most similar to Cypriots are Russian (9.9%, a difference of 0.080%), Immigrants from Pakistan (9.9%, a difference of 0.090%), Korean (9.9%, a difference of 0.10%), Immigrants from Iran (9.9%, a difference of 0.34%), and Immigrants from Greece (9.8%, a difference of 0.46%).
| Demographics | Rating | Rank | Male Poverty |
| Immigrants | Northern Europe | 99.5 /100 | #33 | Exceptional 9.7% |
| Immigrants | Poland | 99.5 /100 | #34 | Exceptional 9.8% |
| Iranians | 99.4 /100 | #35 | Exceptional 9.8% |
| Czechs | 99.4 /100 | #36 | Exceptional 9.8% |
| Immigrants | Greece | 99.3 /100 | #37 | Exceptional 9.8% |
| Immigrants | Pakistan | 99.2 /100 | #38 | Exceptional 9.9% |
| Russians | 99.2 /100 | #39 | Exceptional 9.9% |
| Cypriots | 99.2 /100 | #40 | Exceptional 9.9% |
| Koreans | 99.2 /100 | #41 | Exceptional 9.9% |
| Immigrants | Iran | 99.1 /100 | #42 | Exceptional 9.9% |
| Immigrants | Moldova | 99.0 /100 | #43 | Exceptional 9.9% |
| Immigrants | Romania | 98.9 /100 | #44 | Exceptional 9.9% |
| Immigrants | Serbia | 98.9 /100 | #45 | Exceptional 10.0% |
| Turks | 98.9 /100 | #46 | Exceptional 10.0% |
| Immigrants | Singapore | 98.8 /100 | #47 | Exceptional 10.0% |
Demographics Similar to Immigrants from Switzerland by Male Poverty
In terms of male poverty, the demographic groups most similar to Immigrants from Switzerland are Yugoslavian (10.8%, a difference of 0.15%), Immigrants from Israel (10.8%, a difference of 0.26%), Immigrants from Jordan (10.8%, a difference of 0.27%), Tlingit-Haida (10.9%, a difference of 0.46%), and Immigrants from France (10.9%, a difference of 0.49%).
| Demographics | Rating | Rank | Male Poverty |
| Chileans | 83.9 /100 | #130 | Excellent 10.7% |
| Immigrants | Belarus | 83.3 /100 | #131 | Excellent 10.7% |
| Immigrants | Vietnam | 83.0 /100 | #132 | Excellent 10.8% |
| Pakistanis | 83.0 /100 | #133 | Excellent 10.8% |
| New Zealanders | 82.9 /100 | #134 | Excellent 10.8% |
| Brazilians | 82.7 /100 | #135 | Excellent 10.8% |
| Immigrants | Israel | 80.9 /100 | #136 | Excellent 10.8% |
| Immigrants | Switzerland | 79.2 /100 | #137 | Good 10.8% |
| Yugoslavians | 78.2 /100 | #138 | Good 10.8% |
| Immigrants | Jordan | 77.5 /100 | #139 | Good 10.8% |
| Tlingit-Haida | 76.1 /100 | #140 | Good 10.9% |
| Immigrants | France | 75.8 /100 | #141 | Good 10.9% |
| Basques | 74.6 /100 | #142 | Good 10.9% |
| Afghans | 71.9 /100 | #143 | Good 10.9% |
| Samoans | 71.8 /100 | #144 | Good 10.9% |