Immigrants from Cameroon vs Danish Receiving Food Stamps
COMPARE
Immigrants from Cameroon
Danish
Receiving Food Stamps
Receiving Food Stamps Comparison
Immigrants from Cameroon
Danes
12.0%
RECEIVING FOOD STAMPS
32.5/ 100
METRIC RATING
189th/ 347
METRIC RANK
9.0%
RECEIVING FOOD STAMPS
99.9/ 100
METRIC RATING
18th/ 347
METRIC RANK
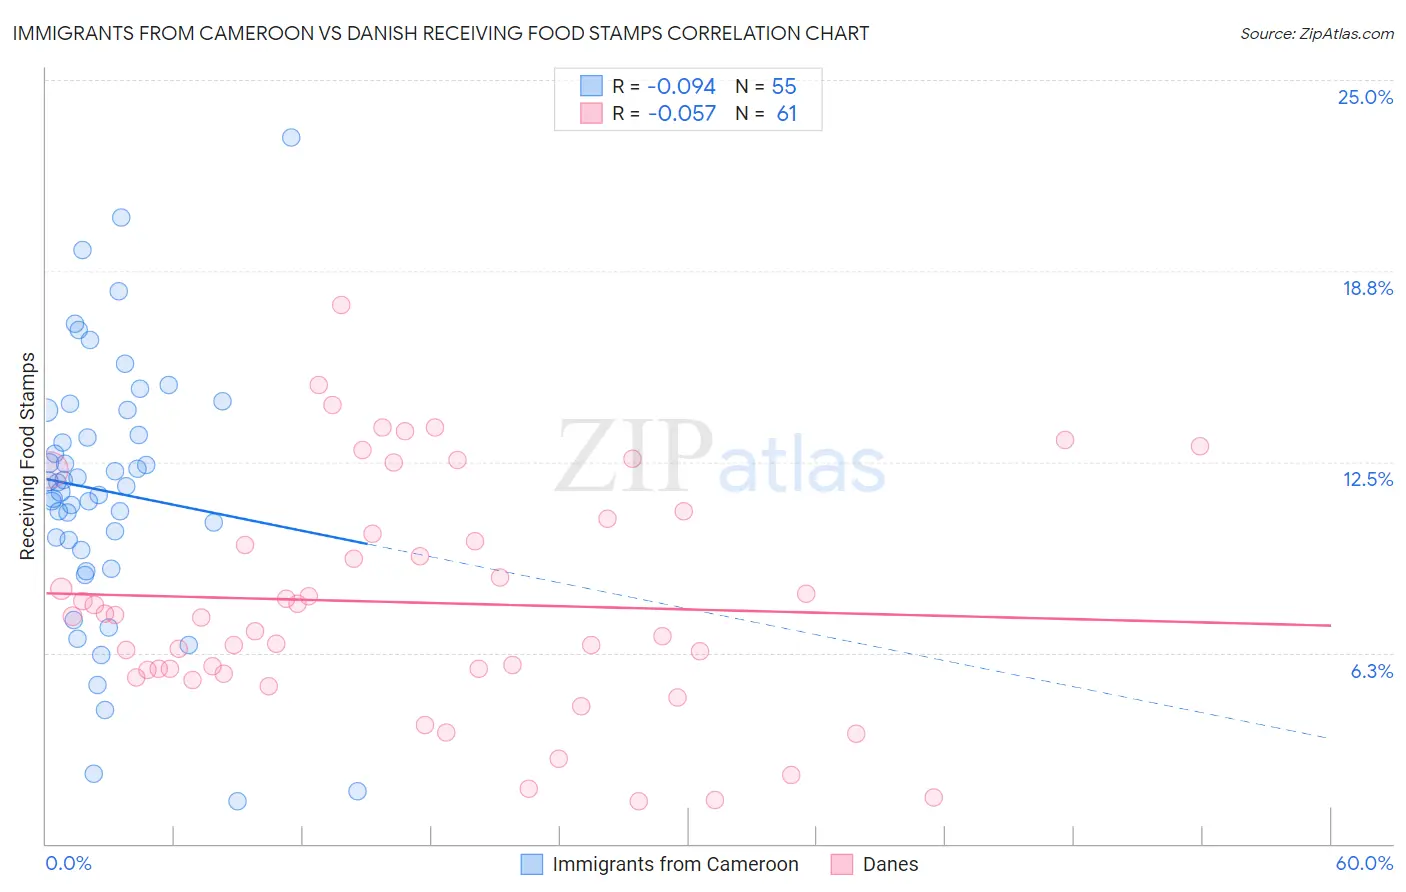
Immigrants from Cameroon vs Danish Receiving Food Stamps Correlation Chart
The statistical analysis conducted on geographies consisting of 130,693,457 people shows a slight negative correlation between the proportion of Immigrants from Cameroon and percentage of population receiving government assistance and/or food stamps in the United States with a correlation coefficient (R) of -0.094 and weighted average of 12.0%. Similarly, the statistical analysis conducted on geographies consisting of 472,155,016 people shows a slight negative correlation between the proportion of Danes and percentage of population receiving government assistance and/or food stamps in the United States with a correlation coefficient (R) of -0.057 and weighted average of 9.0%, a difference of 33.2%.
Receiving Food Stamps Correlation Summary
| Measurement | Immigrants from Cameroon | Danish |
| Minimum | 1.4% | 1.4% |
| Maximum | 23.1% | 17.7% |
| Range | 21.7% | 16.3% |
| Mean | 11.5% | 7.9% |
| Median | 11.7% | 7.4% |
| Interquartile 25% (IQ1) | 9.6% | 5.6% |
| Interquartile 75% (IQ3) | 14.2% | 10.4% |
| Interquartile Range (IQR) | 4.6% | 4.8% |
| Standard Deviation (Sample) | 4.3% | 3.7% |
| Standard Deviation (Population) | 4.3% | 3.7% |
Similar Demographics by Receiving Food Stamps
Demographics Similar to Immigrants from Cameroon by Receiving Food Stamps
In terms of receiving food stamps, the demographic groups most similar to Immigrants from Cameroon are Immigrants from Peru (12.0%, a difference of 0.060%), Venezuelan (12.0%, a difference of 0.060%), Sudanese (12.0%, a difference of 0.14%), Samoan (12.1%, a difference of 0.24%), and Albanian (12.0%, a difference of 0.44%).
| Demographics | Rating | Rank | Receiving Food Stamps |
| Immigrants | Morocco | 40.7 /100 | #182 | Average 11.9% |
| Immigrants | Uganda | 40.3 /100 | #183 | Average 11.9% |
| Spaniards | 39.8 /100 | #184 | Fair 11.9% |
| Immigrants | Iraq | 37.1 /100 | #185 | Fair 12.0% |
| Spanish | 36.9 /100 | #186 | Fair 12.0% |
| Albanians | 35.4 /100 | #187 | Fair 12.0% |
| Sudanese | 33.4 /100 | #188 | Fair 12.0% |
| Immigrants | Cameroon | 32.5 /100 | #189 | Fair 12.0% |
| Immigrants | Peru | 32.2 /100 | #190 | Fair 12.0% |
| Venezuelans | 32.1 /100 | #191 | Fair 12.0% |
| Samoans | 31.0 /100 | #192 | Fair 12.1% |
| Immigrants | Fiji | 27.8 /100 | #193 | Fair 12.1% |
| Immigrants | Sudan | 27.1 /100 | #194 | Fair 12.1% |
| Americans | 26.7 /100 | #195 | Fair 12.2% |
| Iraqis | 26.6 /100 | #196 | Fair 12.2% |
Demographics Similar to Danes by Receiving Food Stamps
In terms of receiving food stamps, the demographic groups most similar to Danes are Immigrants from Scotland (9.0%, a difference of 0.45%), Immigrants from Hong Kong (9.1%, a difference of 0.58%), Immigrants from Japan (9.0%, a difference of 0.61%), Norwegian (9.0%, a difference of 0.88%), and Latvian (9.1%, a difference of 0.91%).
| Demographics | Rating | Rank | Receiving Food Stamps |
| Okinawans | 99.9 /100 | #11 | Exceptional 8.9% |
| Cypriots | 99.9 /100 | #12 | Exceptional 8.9% |
| Bulgarians | 99.9 /100 | #13 | Exceptional 8.9% |
| Maltese | 99.9 /100 | #14 | Exceptional 8.9% |
| Norwegians | 99.9 /100 | #15 | Exceptional 9.0% |
| Immigrants | Japan | 99.9 /100 | #16 | Exceptional 9.0% |
| Immigrants | Scotland | 99.9 /100 | #17 | Exceptional 9.0% |
| Danes | 99.9 /100 | #18 | Exceptional 9.0% |
| Immigrants | Hong Kong | 99.8 /100 | #19 | Exceptional 9.1% |
| Latvians | 99.8 /100 | #20 | Exceptional 9.1% |
| Luxembourgers | 99.8 /100 | #21 | Exceptional 9.1% |
| Immigrants | Australia | 99.8 /100 | #22 | Exceptional 9.2% |
| Eastern Europeans | 99.8 /100 | #23 | Exceptional 9.2% |
| Immigrants | Northern Europe | 99.8 /100 | #24 | Exceptional 9.2% |
| Immigrants | Ireland | 99.8 /100 | #25 | Exceptional 9.2% |