Immigrants from Cameroon vs Jordanian Receiving Food Stamps
COMPARE
Immigrants from Cameroon
Jordanian
Receiving Food Stamps
Receiving Food Stamps Comparison
Immigrants from Cameroon
Jordanians
12.0%
RECEIVING FOOD STAMPS
32.5/ 100
METRIC RATING
189th/ 347
METRIC RANK
10.2%
RECEIVING FOOD STAMPS
97.9/ 100
METRIC RATING
91st/ 347
METRIC RANK
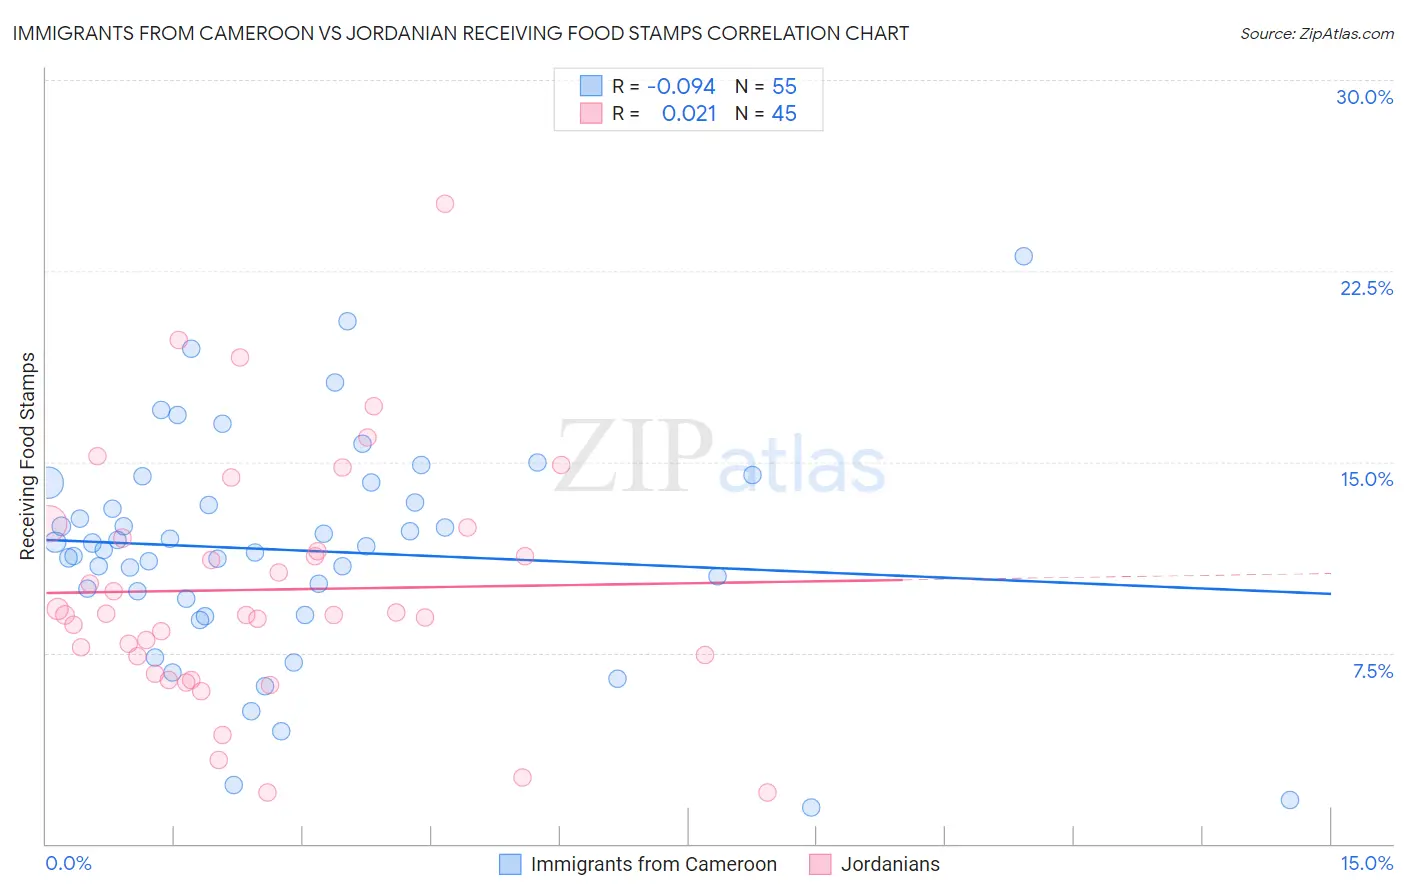
Immigrants from Cameroon vs Jordanian Receiving Food Stamps Correlation Chart
The statistical analysis conducted on geographies consisting of 130,693,457 people shows a slight negative correlation between the proportion of Immigrants from Cameroon and percentage of population receiving government assistance and/or food stamps in the United States with a correlation coefficient (R) of -0.094 and weighted average of 12.0%. Similarly, the statistical analysis conducted on geographies consisting of 166,269,073 people shows no correlation between the proportion of Jordanians and percentage of population receiving government assistance and/or food stamps in the United States with a correlation coefficient (R) of 0.021 and weighted average of 10.2%, a difference of 18.5%.
Receiving Food Stamps Correlation Summary
| Measurement | Immigrants from Cameroon | Jordanian |
| Minimum | 1.4% | 2.0% |
| Maximum | 23.1% | 25.2% |
| Range | 21.7% | 23.2% |
| Mean | 11.5% | 10.0% |
| Median | 11.7% | 9.0% |
| Interquartile 25% (IQ1) | 9.6% | 7.0% |
| Interquartile 75% (IQ3) | 14.2% | 12.2% |
| Interquartile Range (IQR) | 4.6% | 5.2% |
| Standard Deviation (Sample) | 4.3% | 4.8% |
| Standard Deviation (Population) | 4.3% | 4.7% |
Similar Demographics by Receiving Food Stamps
Demographics Similar to Immigrants from Cameroon by Receiving Food Stamps
In terms of receiving food stamps, the demographic groups most similar to Immigrants from Cameroon are Immigrants from Peru (12.0%, a difference of 0.060%), Venezuelan (12.0%, a difference of 0.060%), Sudanese (12.0%, a difference of 0.14%), Samoan (12.1%, a difference of 0.24%), and Albanian (12.0%, a difference of 0.44%).
| Demographics | Rating | Rank | Receiving Food Stamps |
| Immigrants | Morocco | 40.7 /100 | #182 | Average 11.9% |
| Immigrants | Uganda | 40.3 /100 | #183 | Average 11.9% |
| Spaniards | 39.8 /100 | #184 | Fair 11.9% |
| Immigrants | Iraq | 37.1 /100 | #185 | Fair 12.0% |
| Spanish | 36.9 /100 | #186 | Fair 12.0% |
| Albanians | 35.4 /100 | #187 | Fair 12.0% |
| Sudanese | 33.4 /100 | #188 | Fair 12.0% |
| Immigrants | Cameroon | 32.5 /100 | #189 | Fair 12.0% |
| Immigrants | Peru | 32.2 /100 | #190 | Fair 12.0% |
| Venezuelans | 32.1 /100 | #191 | Fair 12.0% |
| Samoans | 31.0 /100 | #192 | Fair 12.1% |
| Immigrants | Fiji | 27.8 /100 | #193 | Fair 12.1% |
| Immigrants | Sudan | 27.1 /100 | #194 | Fair 12.1% |
| Americans | 26.7 /100 | #195 | Fair 12.2% |
| Iraqis | 26.6 /100 | #196 | Fair 12.2% |
Demographics Similar to Jordanians by Receiving Food Stamps
In terms of receiving food stamps, the demographic groups most similar to Jordanians are Irish (10.2%, a difference of 0.0%), Finnish (10.2%, a difference of 0.040%), Belgian (10.2%, a difference of 0.39%), Immigrants from France (10.1%, a difference of 0.89%), and Immigrants from Greece (10.3%, a difference of 0.91%).
| Demographics | Rating | Rank | Receiving Food Stamps |
| Immigrants | Israel | 98.5 /100 | #84 | Exceptional 10.0% |
| Immigrants | Romania | 98.5 /100 | #85 | Exceptional 10.0% |
| Immigrants | Norway | 98.4 /100 | #86 | Exceptional 10.0% |
| Egyptians | 98.4 /100 | #87 | Exceptional 10.0% |
| Immigrants | Kuwait | 98.4 /100 | #88 | Exceptional 10.0% |
| Immigrants | France | 98.3 /100 | #89 | Exceptional 10.1% |
| Finns | 97.9 /100 | #90 | Exceptional 10.2% |
| Jordanians | 97.9 /100 | #91 | Exceptional 10.2% |
| Irish | 97.9 /100 | #92 | Exceptional 10.2% |
| Belgians | 97.7 /100 | #93 | Exceptional 10.2% |
| Immigrants | Greece | 97.4 /100 | #94 | Exceptional 10.3% |
| Basques | 97.4 /100 | #95 | Exceptional 10.3% |
| Welsh | 97.3 /100 | #96 | Exceptional 10.3% |
| Czechoslovakians | 97.2 /100 | #97 | Exceptional 10.3% |
| Immigrants | Egypt | 97.1 /100 | #98 | Exceptional 10.3% |