Immigrants from Cameroon vs Black/African American Receiving Food Stamps
COMPARE
Immigrants from Cameroon
Black/African American
Receiving Food Stamps
Receiving Food Stamps Comparison
Immigrants from Cameroon
Blacks/African Americans
12.0%
RECEIVING FOOD STAMPS
32.5/ 100
METRIC RATING
189th/ 347
METRIC RANK
17.2%
RECEIVING FOOD STAMPS
0.0/ 100
METRIC RATING
317th/ 347
METRIC RANK
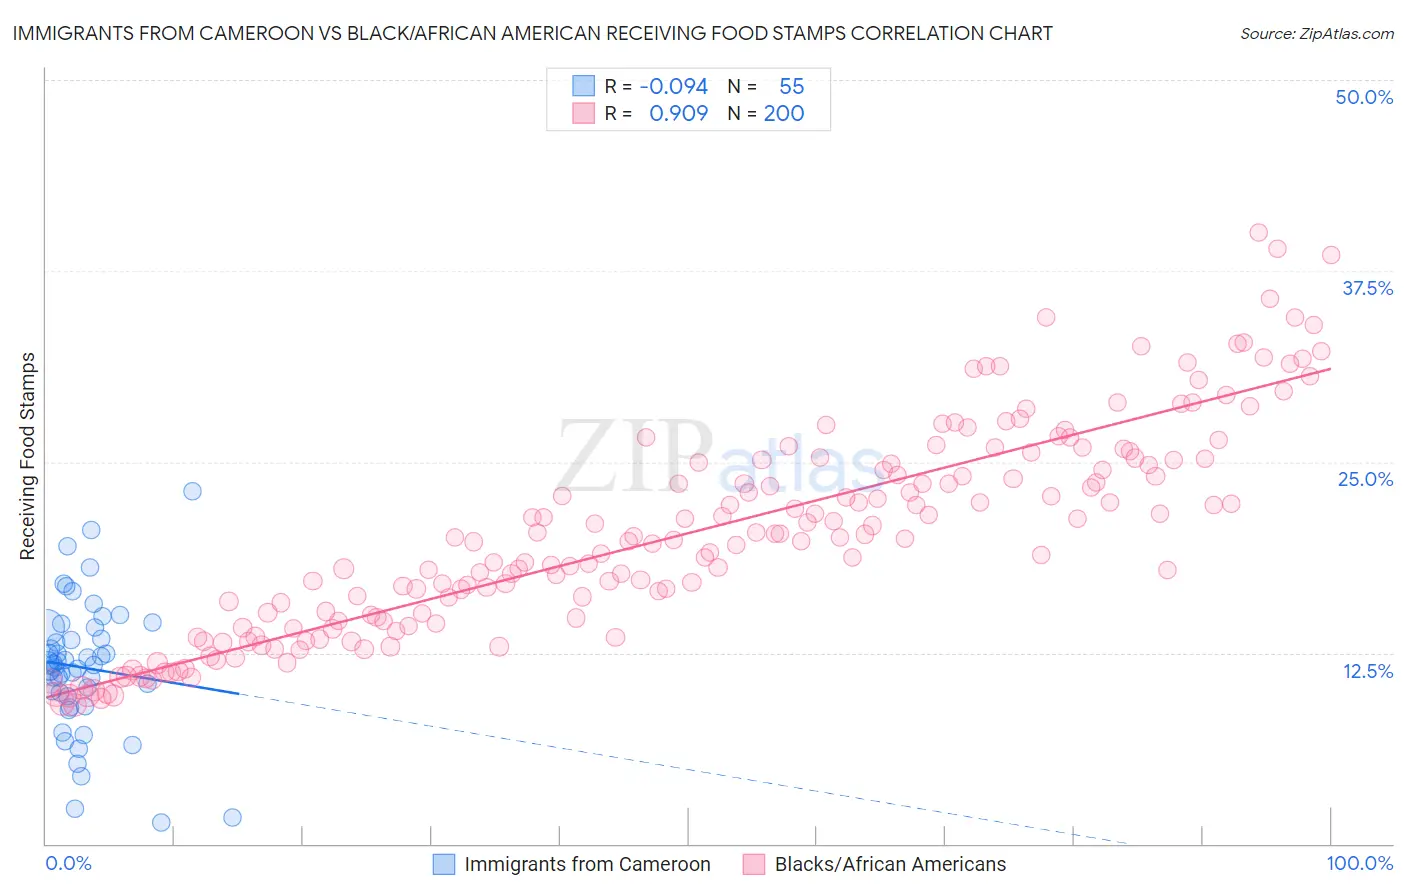
Immigrants from Cameroon vs Black/African American Receiving Food Stamps Correlation Chart
The statistical analysis conducted on geographies consisting of 130,693,457 people shows a slight negative correlation between the proportion of Immigrants from Cameroon and percentage of population receiving government assistance and/or food stamps in the United States with a correlation coefficient (R) of -0.094 and weighted average of 12.0%. Similarly, the statistical analysis conducted on geographies consisting of 562,963,519 people shows a near-perfect positive correlation between the proportion of Blacks/African Americans and percentage of population receiving government assistance and/or food stamps in the United States with a correlation coefficient (R) of 0.909 and weighted average of 17.2%, a difference of 42.6%.
Receiving Food Stamps Correlation Summary
| Measurement | Immigrants from Cameroon | Black/African American |
| Minimum | 1.4% | 9.1% |
| Maximum | 23.1% | 40.0% |
| Range | 21.7% | 31.0% |
| Mean | 11.5% | 20.3% |
| Median | 11.7% | 20.0% |
| Interquartile 25% (IQ1) | 9.6% | 14.7% |
| Interquartile 75% (IQ3) | 14.2% | 25.0% |
| Interquartile Range (IQR) | 4.6% | 10.3% |
| Standard Deviation (Sample) | 4.3% | 6.8% |
| Standard Deviation (Population) | 4.3% | 6.8% |
Similar Demographics by Receiving Food Stamps
Demographics Similar to Immigrants from Cameroon by Receiving Food Stamps
In terms of receiving food stamps, the demographic groups most similar to Immigrants from Cameroon are Immigrants from Peru (12.0%, a difference of 0.060%), Venezuelan (12.0%, a difference of 0.060%), Sudanese (12.0%, a difference of 0.14%), Samoan (12.1%, a difference of 0.24%), and Albanian (12.0%, a difference of 0.44%).
| Demographics | Rating | Rank | Receiving Food Stamps |
| Immigrants | Morocco | 40.7 /100 | #182 | Average 11.9% |
| Immigrants | Uganda | 40.3 /100 | #183 | Average 11.9% |
| Spaniards | 39.8 /100 | #184 | Fair 11.9% |
| Immigrants | Iraq | 37.1 /100 | #185 | Fair 12.0% |
| Spanish | 36.9 /100 | #186 | Fair 12.0% |
| Albanians | 35.4 /100 | #187 | Fair 12.0% |
| Sudanese | 33.4 /100 | #188 | Fair 12.0% |
| Immigrants | Cameroon | 32.5 /100 | #189 | Fair 12.0% |
| Immigrants | Peru | 32.2 /100 | #190 | Fair 12.0% |
| Venezuelans | 32.1 /100 | #191 | Fair 12.0% |
| Samoans | 31.0 /100 | #192 | Fair 12.1% |
| Immigrants | Fiji | 27.8 /100 | #193 | Fair 12.1% |
| Immigrants | Sudan | 27.1 /100 | #194 | Fair 12.1% |
| Americans | 26.7 /100 | #195 | Fair 12.2% |
| Iraqis | 26.6 /100 | #196 | Fair 12.2% |
Demographics Similar to Blacks/African Americans by Receiving Food Stamps
In terms of receiving food stamps, the demographic groups most similar to Blacks/African Americans are Menominee (17.2%, a difference of 0.17%), Immigrants from St. Vincent and the Grenadines (17.2%, a difference of 0.35%), Immigrants from Nicaragua (17.2%, a difference of 0.43%), Central American Indian (17.1%, a difference of 0.53%), and Native/Alaskan (17.3%, a difference of 0.62%).
| Demographics | Rating | Rank | Receiving Food Stamps |
| Immigrants | Barbados | 0.0 /100 | #310 | Tragic 16.6% |
| Guyanese | 0.0 /100 | #311 | Tragic 16.7% |
| Sioux | 0.0 /100 | #312 | Tragic 16.8% |
| Immigrants | Jamaica | 0.0 /100 | #313 | Tragic 16.9% |
| Immigrants | Guyana | 0.0 /100 | #314 | Tragic 16.9% |
| Bahamians | 0.0 /100 | #315 | Tragic 17.0% |
| Central American Indians | 0.0 /100 | #316 | Tragic 17.1% |
| Blacks/African Americans | 0.0 /100 | #317 | Tragic 17.2% |
| Menominee | 0.0 /100 | #318 | Tragic 17.2% |
| Immigrants | St. Vincent and the Grenadines | 0.0 /100 | #319 | Tragic 17.2% |
| Immigrants | Nicaragua | 0.0 /100 | #320 | Tragic 17.2% |
| Natives/Alaskans | 0.0 /100 | #321 | Tragic 17.3% |
| Immigrants | Grenada | 0.0 /100 | #322 | Tragic 17.8% |
| Haitians | 0.0 /100 | #323 | Tragic 17.8% |
| British West Indians | 0.0 /100 | #324 | Tragic 17.9% |