Immigrants from Burma/Myanmar vs Immigrants from Mexico Child Poverty Under the Age of 5
COMPARE
Immigrants from Burma/Myanmar
Immigrants from Mexico
Child Poverty Under the Age of 5
Child Poverty Under the Age of 5 Comparison
Immigrants from Burma/Myanmar
Immigrants from Mexico
20.4%
CHILD POVERTY UNDER THE AGE OF 5
0.1/ 100
METRIC RATING
269th/ 347
METRIC RANK
22.2%
CHILD POVERTY UNDER THE AGE OF 5
0.0/ 100
METRIC RATING
305th/ 347
METRIC RANK
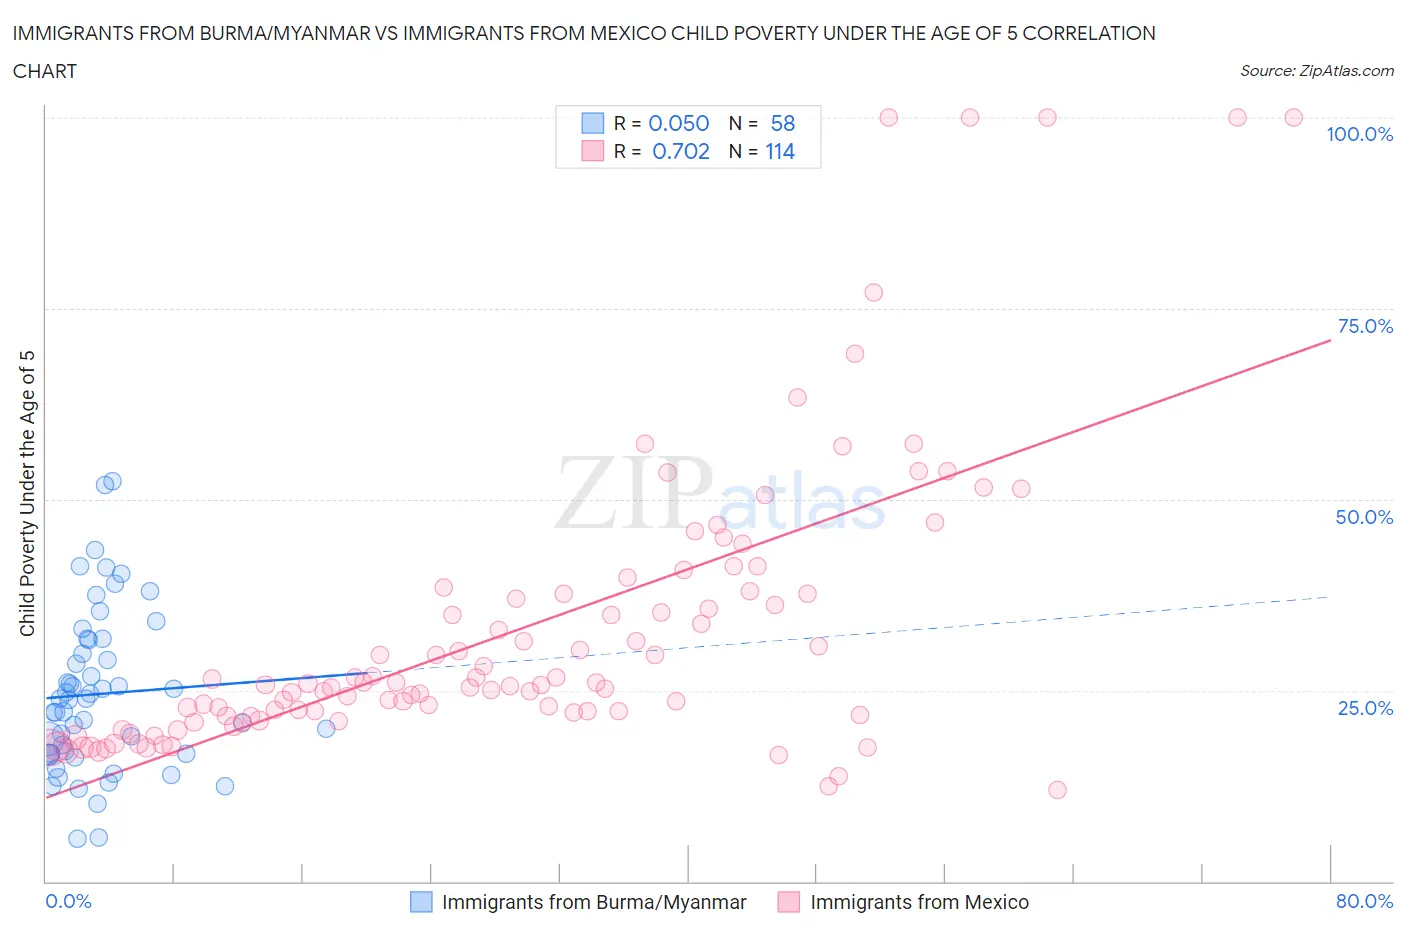
Immigrants from Burma/Myanmar vs Immigrants from Mexico Child Poverty Under the Age of 5 Correlation Chart
The statistical analysis conducted on geographies consisting of 169,386,512 people shows a slight positive correlation between the proportion of Immigrants from Burma/Myanmar and poverty level among children under the age of 5 in the United States with a correlation coefficient (R) of 0.050 and weighted average of 20.4%. Similarly, the statistical analysis conducted on geographies consisting of 489,190,038 people shows a strong positive correlation between the proportion of Immigrants from Mexico and poverty level among children under the age of 5 in the United States with a correlation coefficient (R) of 0.702 and weighted average of 22.2%, a difference of 9.2%.
Child Poverty Under the Age of 5 Correlation Summary
| Measurement | Immigrants from Burma/Myanmar | Immigrants from Mexico |
| Minimum | 5.5% | 11.9% |
| Maximum | 52.3% | 100.0% |
| Range | 46.9% | 88.1% |
| Mean | 24.5% | 32.8% |
| Median | 23.8% | 25.8% |
| Interquartile 25% (IQ1) | 16.7% | 21.7% |
| Interquartile 75% (IQ3) | 31.6% | 37.6% |
| Interquartile Range (IQR) | 15.0% | 16.0% |
| Standard Deviation (Sample) | 10.5% | 19.1% |
| Standard Deviation (Population) | 10.4% | 19.0% |
Similar Demographics by Child Poverty Under the Age of 5
Demographics Similar to Immigrants from Burma/Myanmar by Child Poverty Under the Age of 5
In terms of child poverty under the age of 5, the demographic groups most similar to Immigrants from Burma/Myanmar are Jamaican (20.4%, a difference of 0.070%), Ottawa (20.3%, a difference of 0.090%), Belizean (20.3%, a difference of 0.090%), Aleut (20.3%, a difference of 0.48%), and American (20.5%, a difference of 0.52%).
| Demographics | Rating | Rank | Child Poverty Under the Age of 5 |
| Liberians | 0.1 /100 | #262 | Tragic 20.2% |
| Barbadians | 0.1 /100 | #263 | Tragic 20.2% |
| Immigrants | Liberia | 0.1 /100 | #264 | Tragic 20.2% |
| Spanish American Indians | 0.1 /100 | #265 | Tragic 20.2% |
| Aleuts | 0.1 /100 | #266 | Tragic 20.3% |
| Ottawa | 0.1 /100 | #267 | Tragic 20.3% |
| Belizeans | 0.1 /100 | #268 | Tragic 20.3% |
| Immigrants | Burma/Myanmar | 0.1 /100 | #269 | Tragic 20.4% |
| Jamaicans | 0.1 /100 | #270 | Tragic 20.4% |
| Americans | 0.1 /100 | #271 | Tragic 20.5% |
| Immigrants | Jamaica | 0.1 /100 | #272 | Tragic 20.5% |
| Central Americans | 0.1 /100 | #273 | Tragic 20.6% |
| Immigrants | Belize | 0.1 /100 | #274 | Tragic 20.6% |
| Bangladeshis | 0.1 /100 | #275 | Tragic 20.6% |
| West Indians | 0.0 /100 | #276 | Tragic 20.6% |
Demographics Similar to Immigrants from Mexico by Child Poverty Under the Age of 5
In terms of child poverty under the age of 5, the demographic groups most similar to Immigrants from Mexico are Indonesian (22.3%, a difference of 0.060%), Immigrants from Guatemala (22.0%, a difference of 0.87%), Inupiat (22.0%, a difference of 0.98%), Iroquois (22.0%, a difference of 1.1%), and Immigrants from Central America (22.0%, a difference of 1.2%).
| Demographics | Rating | Rank | Child Poverty Under the Age of 5 |
| Blackfeet | 0.0 /100 | #298 | Tragic 21.8% |
| Chickasaw | 0.0 /100 | #299 | Tragic 21.8% |
| Alaskan Athabascans | 0.0 /100 | #300 | Tragic 21.8% |
| Immigrants | Central America | 0.0 /100 | #301 | Tragic 22.0% |
| Iroquois | 0.0 /100 | #302 | Tragic 22.0% |
| Inupiat | 0.0 /100 | #303 | Tragic 22.0% |
| Immigrants | Guatemala | 0.0 /100 | #304 | Tragic 22.0% |
| Immigrants | Mexico | 0.0 /100 | #305 | Tragic 22.2% |
| Indonesians | 0.0 /100 | #306 | Tragic 22.3% |
| Immigrants | Bahamas | 0.0 /100 | #307 | Tragic 22.7% |
| Immigrants | Dominica | 0.0 /100 | #308 | Tragic 22.7% |
| Houma | 0.0 /100 | #309 | Tragic 22.7% |
| Africans | 0.0 /100 | #310 | Tragic 22.8% |
| Seminole | 0.0 /100 | #311 | Tragic 22.8% |
| Hondurans | 0.0 /100 | #312 | Tragic 23.0% |