American vs Immigrants from Fiji Single Mother Poverty
COMPARE
American
Immigrants from Fiji
Single Mother Poverty
Single Mother Poverty Comparison
Americans
Immigrants from Fiji
33.5%
SINGLE MOTHER POVERTY
0.0/ 100
METRIC RATING
303rd/ 347
METRIC RANK
26.6%
SINGLE MOTHER POVERTY
99.9/ 100
METRIC RATING
38th/ 347
METRIC RANK
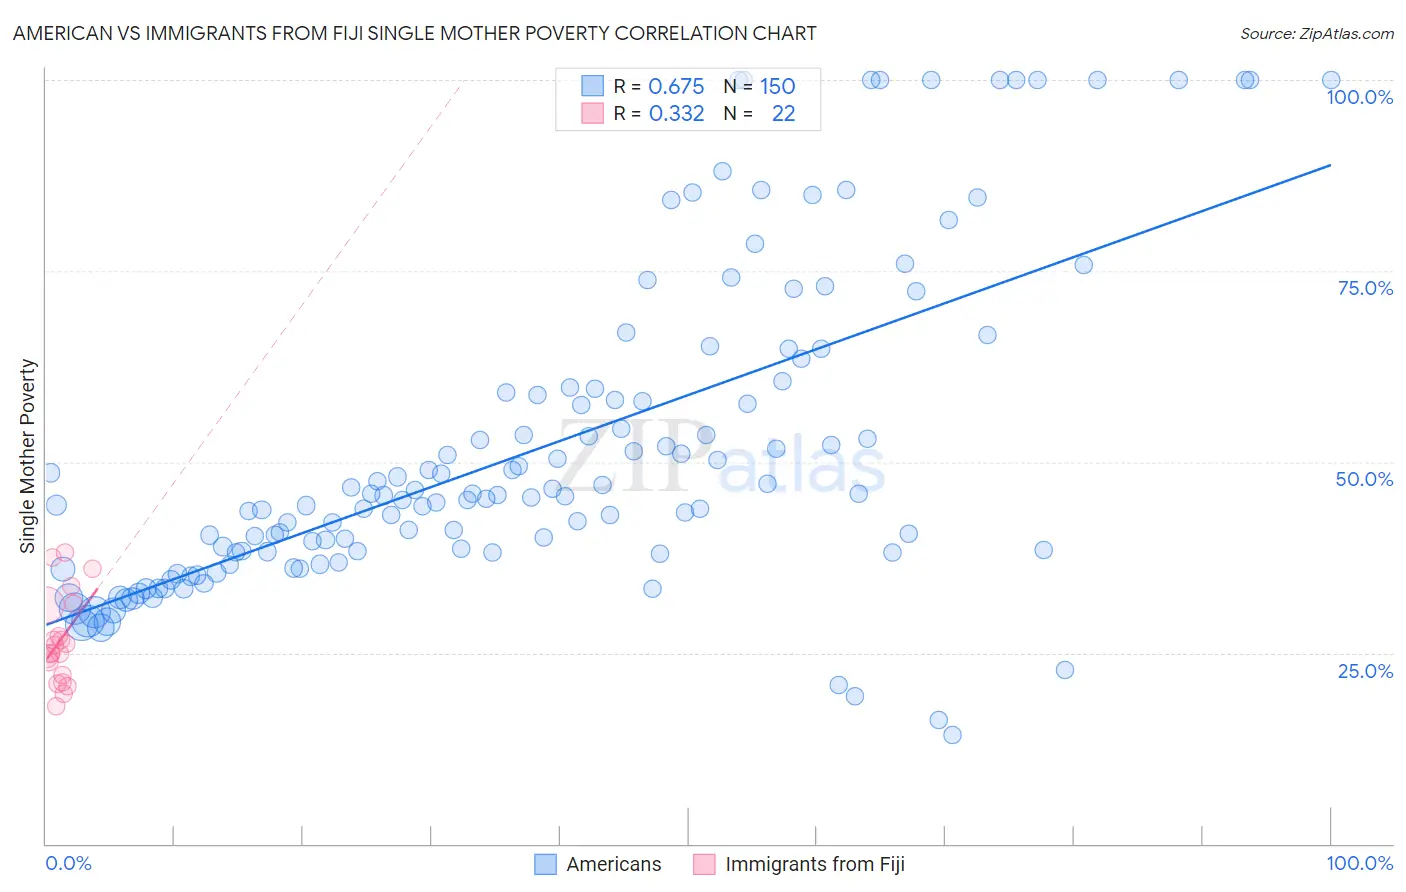
American vs Immigrants from Fiji Single Mother Poverty Correlation Chart
The statistical analysis conducted on geographies consisting of 551,658,648 people shows a significant positive correlation between the proportion of Americans and poverty level among single mothers in the United States with a correlation coefficient (R) of 0.675 and weighted average of 33.5%. Similarly, the statistical analysis conducted on geographies consisting of 93,178,948 people shows a mild positive correlation between the proportion of Immigrants from Fiji and poverty level among single mothers in the United States with a correlation coefficient (R) of 0.332 and weighted average of 26.6%, a difference of 26.0%.
Single Mother Poverty Correlation Summary
| Measurement | American | Immigrants from Fiji |
| Minimum | 14.3% | 18.0% |
| Maximum | 100.0% | 38.1% |
| Range | 85.7% | 20.1% |
| Mean | 51.9% | 26.6% |
| Median | 45.5% | 25.5% |
| Interquartile 25% (IQ1) | 38.2% | 22.0% |
| Interquartile 75% (IQ3) | 59.6% | 31.2% |
| Interquartile Range (IQR) | 21.5% | 9.2% |
| Standard Deviation (Sample) | 21.0% | 5.8% |
| Standard Deviation (Population) | 20.9% | 5.6% |
Similar Demographics by Single Mother Poverty
Demographics Similar to Americans by Single Mother Poverty
In terms of single mother poverty, the demographic groups most similar to Americans are Mexican (33.6%, a difference of 0.10%), Immigrants from Central America (33.6%, a difference of 0.15%), Arapaho (33.4%, a difference of 0.26%), Immigrants from Somalia (33.4%, a difference of 0.41%), and Immigrants from Guatemala (33.3%, a difference of 0.65%).
| Demographics | Rating | Rank | Single Mother Poverty |
| Blackfeet | 0.0 /100 | #296 | Tragic 33.2% |
| Pennsylvania Germans | 0.0 /100 | #297 | Tragic 33.2% |
| Africans | 0.0 /100 | #298 | Tragic 33.3% |
| Immigrants | Guatemala | 0.0 /100 | #299 | Tragic 33.3% |
| Hispanics or Latinos | 0.0 /100 | #300 | Tragic 33.3% |
| Immigrants | Somalia | 0.0 /100 | #301 | Tragic 33.4% |
| Arapaho | 0.0 /100 | #302 | Tragic 33.4% |
| Americans | 0.0 /100 | #303 | Tragic 33.5% |
| Mexicans | 0.0 /100 | #304 | Tragic 33.6% |
| Immigrants | Central America | 0.0 /100 | #305 | Tragic 33.6% |
| Immigrants | Congo | 0.0 /100 | #306 | Tragic 33.8% |
| Comanche | 0.0 /100 | #307 | Tragic 33.9% |
| Immigrants | Mexico | 0.0 /100 | #308 | Tragic 34.0% |
| Potawatomi | 0.0 /100 | #309 | Tragic 34.1% |
| Hondurans | 0.0 /100 | #310 | Tragic 34.2% |
Demographics Similar to Immigrants from Fiji by Single Mother Poverty
In terms of single mother poverty, the demographic groups most similar to Immigrants from Fiji are Okinawan (26.6%, a difference of 0.040%), Immigrants from Israel (26.6%, a difference of 0.040%), Maltese (26.6%, a difference of 0.090%), Immigrants from Indonesia (26.6%, a difference of 0.21%), and Bulgarian (26.5%, a difference of 0.22%).
| Demographics | Rating | Rank | Single Mother Poverty |
| Immigrants | Philippines | 100.0 /100 | #31 | Exceptional 26.5% |
| Tongans | 99.9 /100 | #32 | Exceptional 26.5% |
| Bulgarians | 99.9 /100 | #33 | Exceptional 26.5% |
| Immigrants | Indonesia | 99.9 /100 | #34 | Exceptional 26.6% |
| Maltese | 99.9 /100 | #35 | Exceptional 26.6% |
| Okinawans | 99.9 /100 | #36 | Exceptional 26.6% |
| Immigrants | Israel | 99.9 /100 | #37 | Exceptional 26.6% |
| Immigrants | Fiji | 99.9 /100 | #38 | Exceptional 26.6% |
| Sri Lankans | 99.9 /100 | #39 | Exceptional 26.7% |
| Immigrants | Vietnam | 99.9 /100 | #40 | Exceptional 26.7% |
| Immigrants | Greece | 99.9 /100 | #41 | Exceptional 26.7% |
| Armenians | 99.9 /100 | #42 | Exceptional 26.8% |
| Tsimshian | 99.9 /100 | #43 | Exceptional 26.8% |
| Immigrants | Sierra Leone | 99.9 /100 | #44 | Exceptional 26.9% |
| Latvians | 99.9 /100 | #45 | Exceptional 26.9% |