Immigrants from Bulgaria vs Scotch-Irish Receiving Food Stamps
COMPARE
Immigrants from Bulgaria
Scotch-Irish
Receiving Food Stamps
Receiving Food Stamps Comparison
Immigrants from Bulgaria
Scotch-Irish
9.8%
RECEIVING FOOD STAMPS
99.2/ 100
METRIC RATING
62nd/ 347
METRIC RANK
10.5%
RECEIVING FOOD STAMPS
95.1/ 100
METRIC RATING
114th/ 347
METRIC RANK
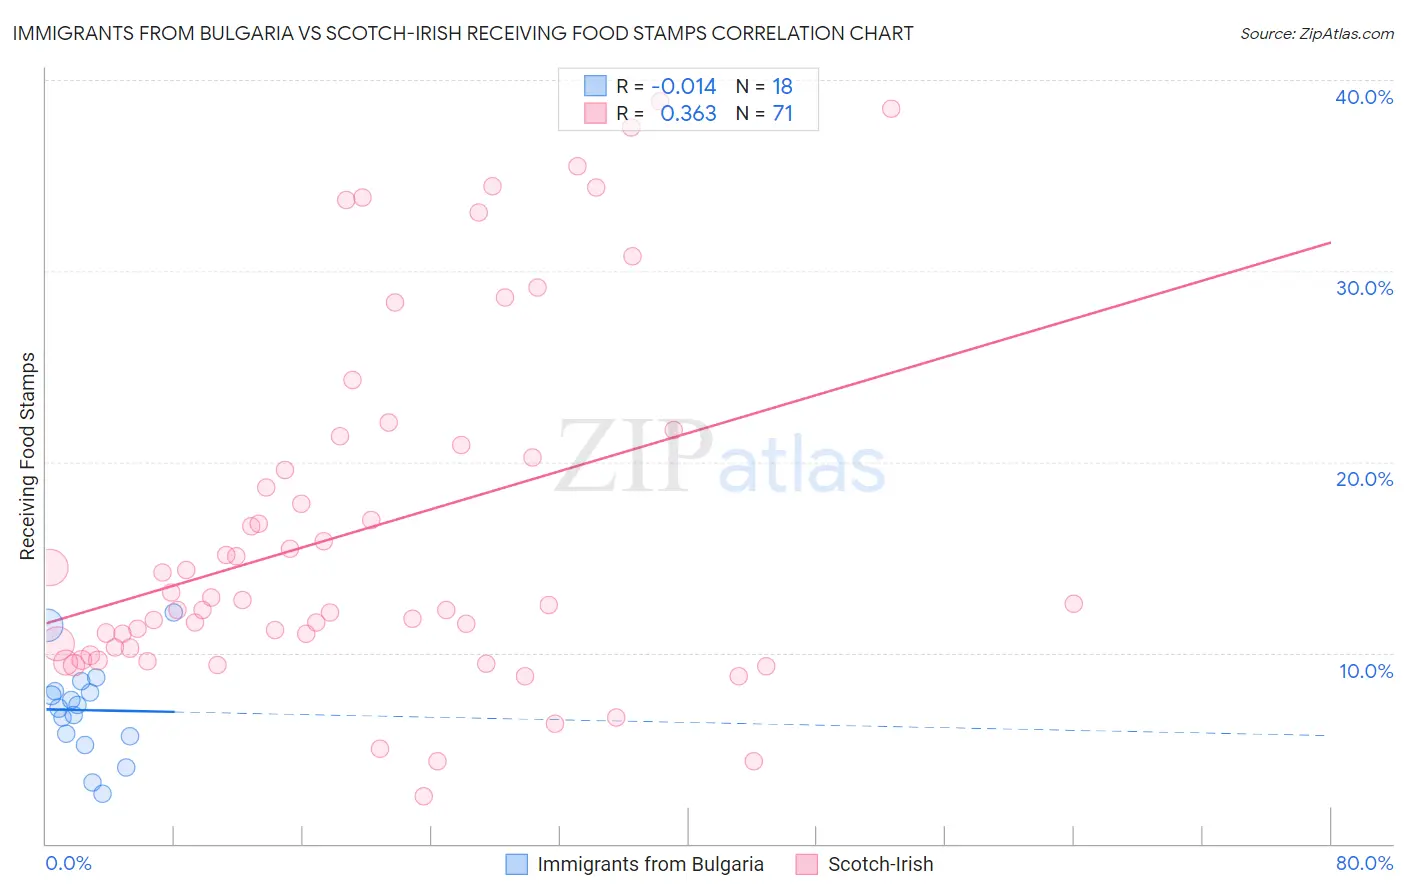
Immigrants from Bulgaria vs Scotch-Irish Receiving Food Stamps Correlation Chart
The statistical analysis conducted on geographies consisting of 172,350,447 people shows no correlation between the proportion of Immigrants from Bulgaria and percentage of population receiving government assistance and/or food stamps in the United States with a correlation coefficient (R) of -0.014 and weighted average of 9.8%. Similarly, the statistical analysis conducted on geographies consisting of 546,022,543 people shows a mild positive correlation between the proportion of Scotch-Irish and percentage of population receiving government assistance and/or food stamps in the United States with a correlation coefficient (R) of 0.363 and weighted average of 10.5%, a difference of 7.7%.
Receiving Food Stamps Correlation Summary
| Measurement | Immigrants from Bulgaria | Scotch-Irish |
| Minimum | 2.6% | 2.5% |
| Maximum | 12.1% | 38.9% |
| Range | 9.5% | 36.4% |
| Mean | 7.0% | 16.4% |
| Median | 7.2% | 12.6% |
| Interquartile 25% (IQ1) | 5.6% | 10.2% |
| Interquartile 75% (IQ3) | 8.0% | 20.9% |
| Interquartile Range (IQR) | 2.4% | 10.7% |
| Standard Deviation (Sample) | 2.5% | 9.3% |
| Standard Deviation (Population) | 2.4% | 9.2% |
Similar Demographics by Receiving Food Stamps
Demographics Similar to Immigrants from Bulgaria by Receiving Food Stamps
In terms of receiving food stamps, the demographic groups most similar to Immigrants from Bulgaria are Chinese (9.8%, a difference of 0.030%), English (9.8%, a difference of 0.080%), Immigrants from North America (9.8%, a difference of 0.12%), German (9.7%, a difference of 0.22%), and Immigrants from Turkey (9.8%, a difference of 0.28%).
| Demographics | Rating | Rank | Receiving Food Stamps |
| Immigrants | Switzerland | 99.3 /100 | #55 | Exceptional 9.7% |
| Immigrants | Canada | 99.3 /100 | #56 | Exceptional 9.7% |
| Greeks | 99.3 /100 | #57 | Exceptional 9.7% |
| Scandinavians | 99.2 /100 | #58 | Exceptional 9.7% |
| British | 99.2 /100 | #59 | Exceptional 9.7% |
| Germans | 99.2 /100 | #60 | Exceptional 9.7% |
| English | 99.2 /100 | #61 | Exceptional 9.8% |
| Immigrants | Bulgaria | 99.2 /100 | #62 | Exceptional 9.8% |
| Chinese | 99.2 /100 | #63 | Exceptional 9.8% |
| Immigrants | North America | 99.2 /100 | #64 | Exceptional 9.8% |
| Immigrants | Turkey | 99.1 /100 | #65 | Exceptional 9.8% |
| Slovenes | 99.1 /100 | #66 | Exceptional 9.8% |
| Immigrants | Indonesia | 99.0 /100 | #67 | Exceptional 9.8% |
| Northern Europeans | 99.0 /100 | #68 | Exceptional 9.8% |
| Italians | 99.0 /100 | #69 | Exceptional 9.9% |
Demographics Similar to Scotch-Irish by Receiving Food Stamps
In terms of receiving food stamps, the demographic groups most similar to Scotch-Irish are Immigrants from Saudi Arabia (10.5%, a difference of 0.18%), Canadian (10.5%, a difference of 0.22%), Icelander (10.5%, a difference of 0.30%), Immigrants from Nepal (10.6%, a difference of 0.39%), and Mongolian (10.5%, a difference of 0.68%).
| Demographics | Rating | Rank | Receiving Food Stamps |
| Koreans | 96.3 /100 | #107 | Exceptional 10.4% |
| Carpatho Rusyns | 96.2 /100 | #108 | Exceptional 10.4% |
| Immigrants | Pakistan | 96.2 /100 | #109 | Exceptional 10.4% |
| Pakistanis | 95.9 /100 | #110 | Exceptional 10.4% |
| Romanians | 95.8 /100 | #111 | Exceptional 10.4% |
| Mongolians | 95.8 /100 | #112 | Exceptional 10.5% |
| Icelanders | 95.4 /100 | #113 | Exceptional 10.5% |
| Scotch-Irish | 95.1 /100 | #114 | Exceptional 10.5% |
| Immigrants | Saudi Arabia | 94.9 /100 | #115 | Exceptional 10.5% |
| Canadians | 94.8 /100 | #116 | Exceptional 10.5% |
| Immigrants | Nepal | 94.6 /100 | #117 | Exceptional 10.6% |
| Assyrians/Chaldeans/Syriacs | 94.1 /100 | #118 | Exceptional 10.6% |
| Immigrants | Poland | 93.9 /100 | #119 | Exceptional 10.6% |
| Ethiopians | 93.9 /100 | #120 | Exceptional 10.6% |
| Slavs | 93.8 /100 | #121 | Exceptional 10.6% |