Immigrants from Bulgaria vs Scotch-Irish 3rd Grade
COMPARE
Immigrants from Bulgaria
Scotch-Irish
3rd Grade
3rd Grade Comparison
Immigrants from Bulgaria
Scotch-Irish
97.9%
3RD GRADE
89.1/ 100
METRIC RATING
131st/ 347
METRIC RANK
98.5%
3RD GRADE
100.0/ 100
METRIC RATING
25th/ 347
METRIC RANK
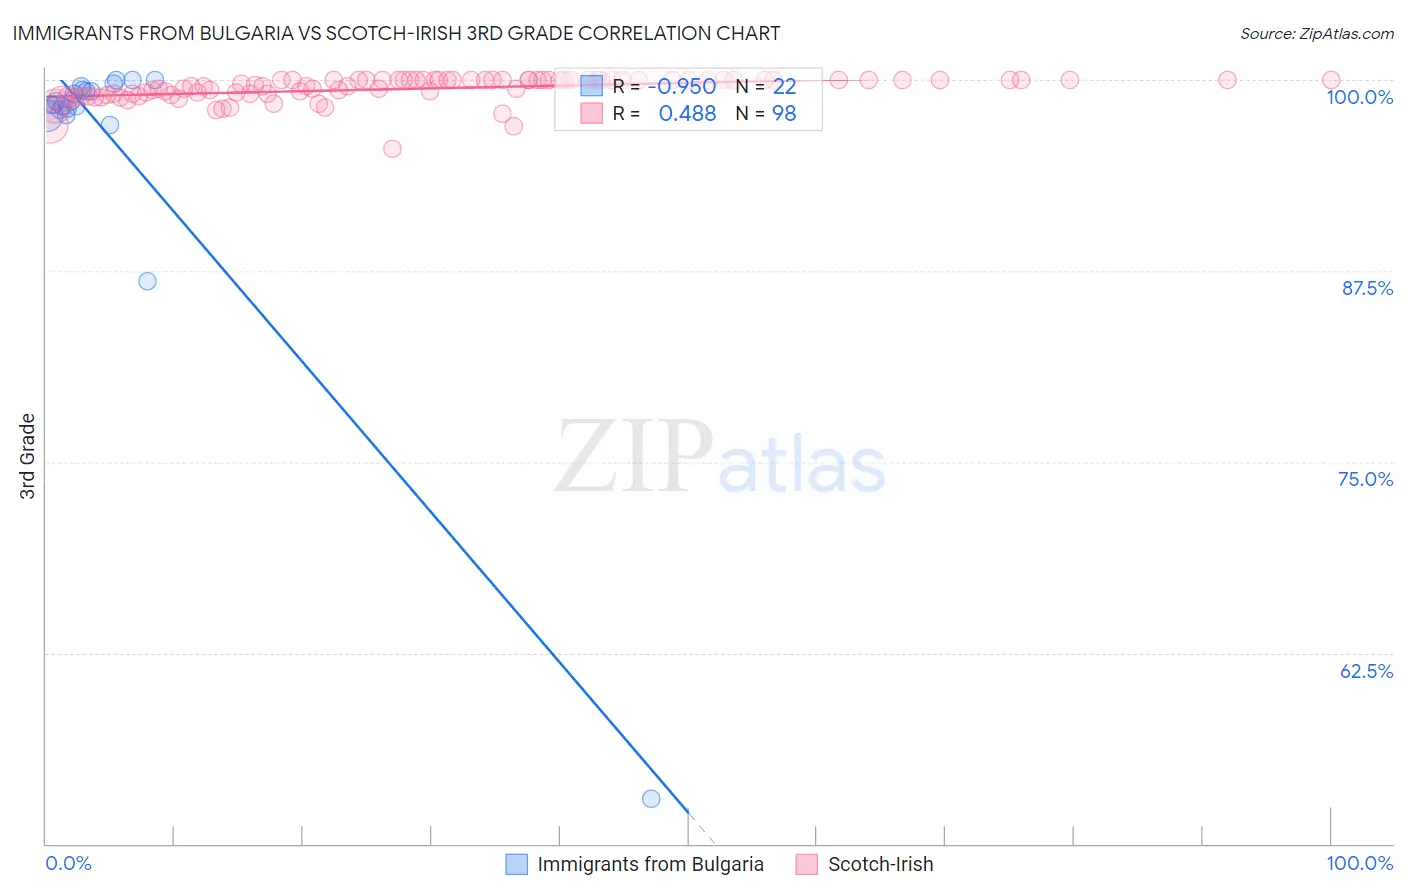
Immigrants from Bulgaria vs Scotch-Irish 3rd Grade Correlation Chart
The statistical analysis conducted on geographies consisting of 172,552,181 people shows a perfect negative correlation between the proportion of Immigrants from Bulgaria and percentage of population with at least 3rd grade education in the United States with a correlation coefficient (R) of -0.950 and weighted average of 97.9%. Similarly, the statistical analysis conducted on geographies consisting of 548,777,407 people shows a moderate positive correlation between the proportion of Scotch-Irish and percentage of population with at least 3rd grade education in the United States with a correlation coefficient (R) of 0.488 and weighted average of 98.5%, a difference of 0.55%.
3rd Grade Correlation Summary
| Measurement | Immigrants from Bulgaria | Scotch-Irish |
| Minimum | 52.9% | 95.5% |
| Maximum | 100.0% | 100.0% |
| Range | 47.1% | 4.5% |
| Mean | 96.1% | 99.4% |
| Median | 98.5% | 99.9% |
| Interquartile 25% (IQ1) | 98.1% | 99.1% |
| Interquartile 75% (IQ3) | 99.4% | 100.0% |
| Interquartile Range (IQR) | 1.3% | 0.92% |
| Standard Deviation (Sample) | 10.0% | 0.79% |
| Standard Deviation (Population) | 9.8% | 0.79% |
Similar Demographics by 3rd Grade
Demographics Similar to Immigrants from Bulgaria by 3rd Grade
In terms of 3rd grade, the demographic groups most similar to Immigrants from Bulgaria are Immigrants from Hungary (97.9%, a difference of 0.0%), Immigrants from Kuwait (97.9%, a difference of 0.0%), Seminole (97.9%, a difference of 0.0%), Cambodian (97.9%, a difference of 0.010%), and Spaniard (97.9%, a difference of 0.010%).
| Demographics | Rating | Rank | 3rd Grade |
| Immigrants | Japan | 93.7 /100 | #124 | Exceptional 98.0% |
| Immigrants | Saudi Arabia | 93.5 /100 | #125 | Exceptional 98.0% |
| Immigrants | Zimbabwe | 93.4 /100 | #126 | Exceptional 98.0% |
| Ute | 93.2 /100 | #127 | Exceptional 98.0% |
| Colville | 92.1 /100 | #128 | Exceptional 98.0% |
| Immigrants | Serbia | 91.9 /100 | #129 | Exceptional 98.0% |
| Immigrants | Europe | 91.2 /100 | #130 | Exceptional 98.0% |
| Immigrants | Bulgaria | 89.1 /100 | #131 | Excellent 97.9% |
| Immigrants | Hungary | 88.8 /100 | #132 | Excellent 97.9% |
| Immigrants | Kuwait | 88.7 /100 | #133 | Excellent 97.9% |
| Seminole | 88.7 /100 | #134 | Excellent 97.9% |
| Cambodians | 88.1 /100 | #135 | Excellent 97.9% |
| Spaniards | 87.9 /100 | #136 | Excellent 97.9% |
| Immigrants | Romania | 87.9 /100 | #137 | Excellent 97.9% |
| Israelis | 86.6 /100 | #138 | Excellent 97.9% |
Demographics Similar to Scotch-Irish by 3rd Grade
In terms of 3rd grade, the demographic groups most similar to Scotch-Irish are Danish (98.5%, a difference of 0.0%), Lithuanian (98.5%, a difference of 0.010%), Finnish (98.5%, a difference of 0.010%), Sioux (98.5%, a difference of 0.010%), and Aleut (98.5%, a difference of 0.010%).
| Demographics | Rating | Rank | 3rd Grade |
| Irish | 100.0 /100 | #18 | Exceptional 98.5% |
| Poles | 100.0 /100 | #19 | Exceptional 98.5% |
| Pennsylvania Germans | 100.0 /100 | #20 | Exceptional 98.5% |
| Lithuanians | 100.0 /100 | #21 | Exceptional 98.5% |
| Finns | 100.0 /100 | #22 | Exceptional 98.5% |
| Sioux | 100.0 /100 | #23 | Exceptional 98.5% |
| Danes | 100.0 /100 | #24 | Exceptional 98.5% |
| Scotch-Irish | 100.0 /100 | #25 | Exceptional 98.5% |
| Aleuts | 100.0 /100 | #26 | Exceptional 98.5% |
| Croatians | 100.0 /100 | #27 | Exceptional 98.5% |
| French | 100.0 /100 | #28 | Exceptional 98.4% |
| French Canadians | 100.0 /100 | #29 | Exceptional 98.4% |
| Europeans | 100.0 /100 | #30 | Exceptional 98.4% |
| Czechs | 100.0 /100 | #31 | Exceptional 98.4% |
| Scandinavians | 100.0 /100 | #32 | Exceptional 98.4% |