Immigrants from Bulgaria vs Scotch-Irish Unemployment Among Women with Children Ages 6 to 17 years
COMPARE
Immigrants from Bulgaria
Scotch-Irish
Unemployment Among Women with Children Ages 6 to 17 years
Unemployment Among Women with Children Ages 6 to 17 years Comparison
Immigrants from Bulgaria
Scotch-Irish
8.1%
UNEMPLOYMENT AMONG WOMEN WITH CHILDREN AGES 6 TO 17 YEARS
100.0/ 100
METRIC RATING
45th/ 347
METRIC RANK
9.7%
UNEMPLOYMENT AMONG WOMEN WITH CHILDREN AGES 6 TO 17 YEARS
0.1/ 100
METRIC RATING
279th/ 347
METRIC RANK
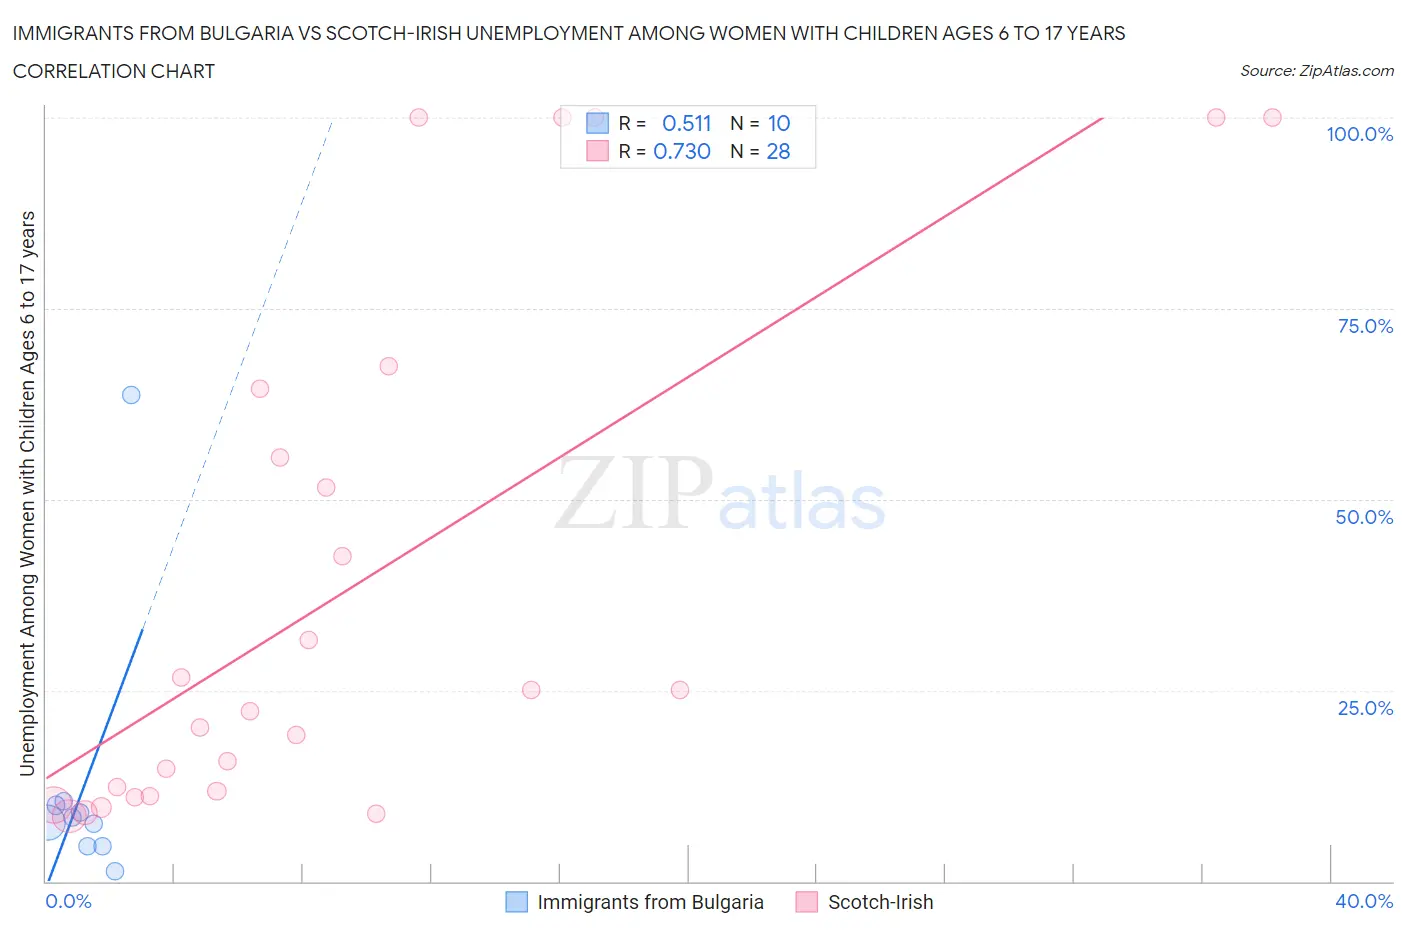
Immigrants from Bulgaria vs Scotch-Irish Unemployment Among Women with Children Ages 6 to 17 years Correlation Chart
The statistical analysis conducted on geographies consisting of 140,311,007 people shows a substantial positive correlation between the proportion of Immigrants from Bulgaria and unemployment rate among women with children between the ages 6 and 17 in the United States with a correlation coefficient (R) of 0.511 and weighted average of 8.1%. Similarly, the statistical analysis conducted on geographies consisting of 346,014,789 people shows a strong positive correlation between the proportion of Scotch-Irish and unemployment rate among women with children between the ages 6 and 17 in the United States with a correlation coefficient (R) of 0.730 and weighted average of 9.7%, a difference of 20.3%.
Unemployment Among Women with Children Ages 6 to 17 years Correlation Summary
| Measurement | Immigrants from Bulgaria | Scotch-Irish |
| Minimum | 1.3% | 8.6% |
| Maximum | 63.6% | 100.0% |
| Range | 62.3% | 91.4% |
| Mean | 12.7% | 38.4% |
| Median | 8.0% | 23.6% |
| Interquartile 25% (IQ1) | 4.6% | 11.4% |
| Interquartile 75% (IQ3) | 10.0% | 60.0% |
| Interquartile Range (IQR) | 5.4% | 48.6% |
| Standard Deviation (Sample) | 18.1% | 33.7% |
| Standard Deviation (Population) | 17.2% | 33.1% |
Similar Demographics by Unemployment Among Women with Children Ages 6 to 17 years
Demographics Similar to Immigrants from Bulgaria by Unemployment Among Women with Children Ages 6 to 17 years
In terms of unemployment among women with children ages 6 to 17 years, the demographic groups most similar to Immigrants from Bulgaria are Icelander (8.1%, a difference of 0.020%), Immigrants from Sweden (8.1%, a difference of 0.050%), Immigrants from Switzerland (8.1%, a difference of 0.060%), Bhutanese (8.1%, a difference of 0.080%), and Immigrants from Asia (8.1%, a difference of 0.18%).
| Demographics | Rating | Rank | Unemployment Among Women with Children Ages 6 to 17 years |
| Alsatians | 100.0 /100 | #38 | Exceptional 8.0% |
| Somalis | 100.0 /100 | #39 | Exceptional 8.0% |
| Immigrants | Zimbabwe | 100.0 /100 | #40 | Exceptional 8.0% |
| Iranians | 100.0 /100 | #41 | Exceptional 8.0% |
| Immigrants | Somalia | 100.0 /100 | #42 | Exceptional 8.0% |
| Bhutanese | 100.0 /100 | #43 | Exceptional 8.1% |
| Immigrants | Sweden | 100.0 /100 | #44 | Exceptional 8.1% |
| Immigrants | Bulgaria | 100.0 /100 | #45 | Exceptional 8.1% |
| Icelanders | 100.0 /100 | #46 | Exceptional 8.1% |
| Immigrants | Switzerland | 100.0 /100 | #47 | Exceptional 8.1% |
| Immigrants | Asia | 100.0 /100 | #48 | Exceptional 8.1% |
| Immigrants | Oceania | 100.0 /100 | #49 | Exceptional 8.1% |
| Hawaiians | 100.0 /100 | #50 | Exceptional 8.1% |
| Immigrants | Sudan | 100.0 /100 | #51 | Exceptional 8.1% |
| Immigrants | Iraq | 100.0 /100 | #52 | Exceptional 8.1% |
Demographics Similar to Scotch-Irish by Unemployment Among Women with Children Ages 6 to 17 years
In terms of unemployment among women with children ages 6 to 17 years, the demographic groups most similar to Scotch-Irish are French (9.7%, a difference of 0.030%), British West Indian (9.7%, a difference of 0.11%), Immigrants from Portugal (9.7%, a difference of 0.16%), U.S. Virgin Islander (9.7%, a difference of 0.17%), and Seminole (9.7%, a difference of 0.19%).
| Demographics | Rating | Rank | Unemployment Among Women with Children Ages 6 to 17 years |
| Kiowa | 0.1 /100 | #272 | Tragic 9.6% |
| Whites/Caucasians | 0.1 /100 | #273 | Tragic 9.6% |
| Aleuts | 0.1 /100 | #274 | Tragic 9.6% |
| U.S. Virgin Islanders | 0.1 /100 | #275 | Tragic 9.7% |
| Immigrants | Portugal | 0.1 /100 | #276 | Tragic 9.7% |
| British West Indians | 0.1 /100 | #277 | Tragic 9.7% |
| French | 0.1 /100 | #278 | Tragic 9.7% |
| Scotch-Irish | 0.1 /100 | #279 | Tragic 9.7% |
| Seminole | 0.1 /100 | #280 | Tragic 9.7% |
| Jamaicans | 0.0 /100 | #281 | Tragic 9.8% |
| Slovaks | 0.0 /100 | #282 | Tragic 9.8% |
| Central American Indians | 0.0 /100 | #283 | Tragic 9.9% |
| Yakama | 0.0 /100 | #284 | Tragic 9.9% |
| Hispanics or Latinos | 0.0 /100 | #285 | Tragic 9.9% |
| Choctaw | 0.0 /100 | #286 | Tragic 9.9% |