Immigrants from Brazil vs Pennsylvania German Median Male Earnings
COMPARE
Immigrants from Brazil
Pennsylvania German
Median Male Earnings
Median Male Earnings Comparison
Immigrants from Brazil
Pennsylvania Germans
$58,324
MEDIAN MALE EARNINGS
97.7/ 100
METRIC RATING
101st/ 347
METRIC RANK
$50,878
MEDIAN MALE EARNINGS
2.8/ 100
METRIC RATING
236th/ 347
METRIC RANK
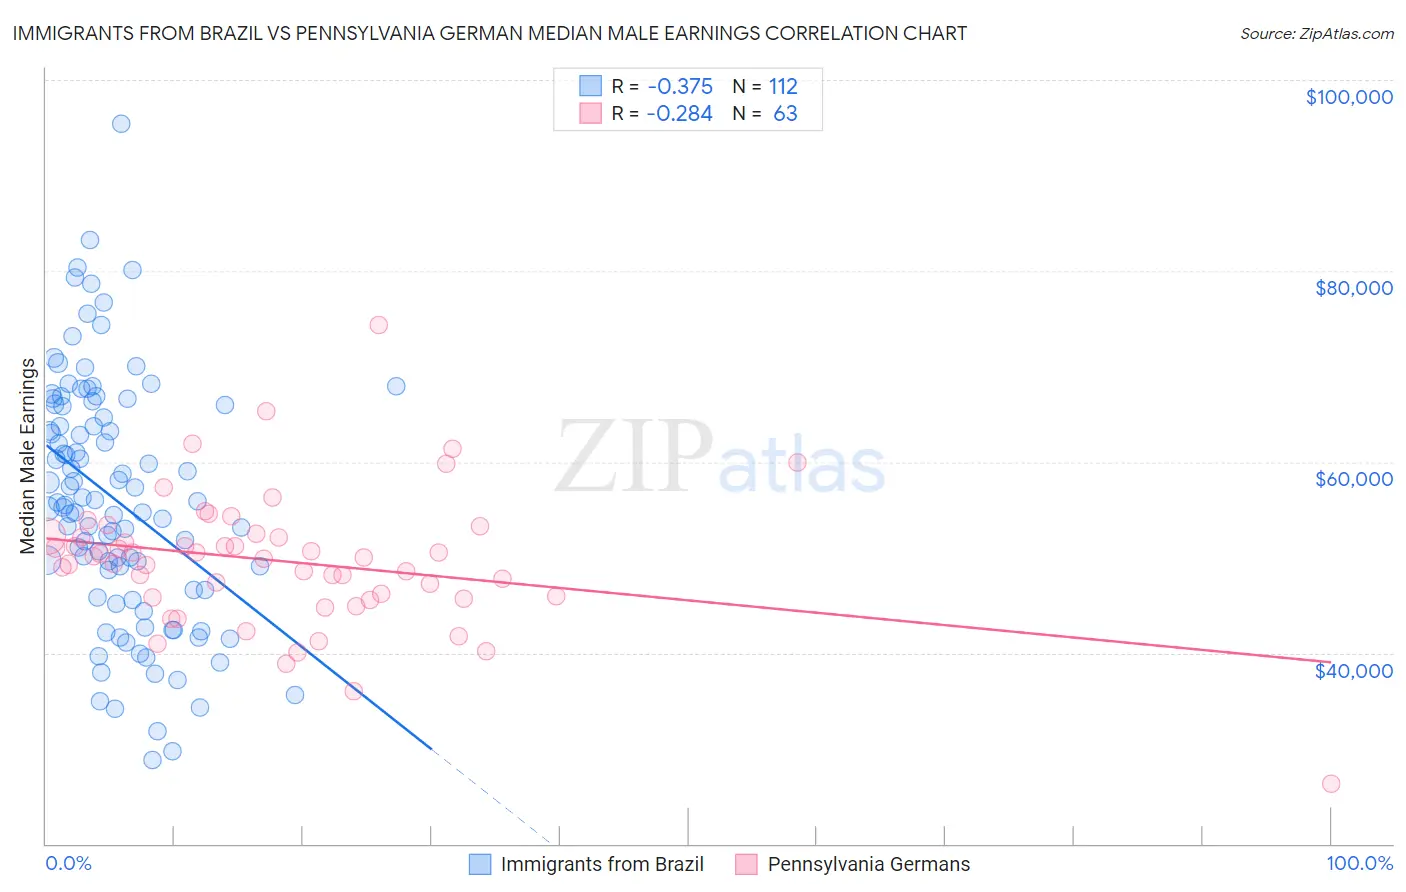
Immigrants from Brazil vs Pennsylvania German Median Male Earnings Correlation Chart
The statistical analysis conducted on geographies consisting of 342,925,188 people shows a mild negative correlation between the proportion of Immigrants from Brazil and median male earnings in the United States with a correlation coefficient (R) of -0.375 and weighted average of $58,324. Similarly, the statistical analysis conducted on geographies consisting of 233,999,386 people shows a weak negative correlation between the proportion of Pennsylvania Germans and median male earnings in the United States with a correlation coefficient (R) of -0.284 and weighted average of $50,878, a difference of 14.6%.
Median Male Earnings Correlation Summary
| Measurement | Immigrants from Brazil | Pennsylvania German |
| Minimum | $28,750 | $26,250 |
| Maximum | $95,391 | $74,375 |
| Range | $66,641 | $48,125 |
| Mean | $55,921 | $49,588 |
| Median | $55,594 | $50,000 |
| Interquartile 25% (IQ1) | $46,610 | $45,795 |
| Interquartile 75% (IQ3) | $65,884 | $52,150 |
| Interquartile Range (IQR) | $19,274 | $6,355 |
| Standard Deviation (Sample) | $12,788 | $7,111 |
| Standard Deviation (Population) | $12,730 | $7,054 |
Similar Demographics by Median Male Earnings
Demographics Similar to Immigrants from Brazil by Median Male Earnings
In terms of median male earnings, the demographic groups most similar to Immigrants from Brazil are Assyrian/Chaldean/Syriac ($58,437, a difference of 0.19%), Immigrants from Poland ($58,452, a difference of 0.22%), Syrian ($58,187, a difference of 0.24%), Jordanian ($58,500, a difference of 0.30%), and Polish ($58,139, a difference of 0.32%).
| Demographics | Rating | Rank | Median Male Earnings |
| Immigrants | North Macedonia | 99.0 /100 | #94 | Exceptional $59,189 |
| Immigrants | Lebanon | 98.6 /100 | #95 | Exceptional $58,835 |
| Albanians | 98.4 /100 | #96 | Exceptional $58,680 |
| Northern Europeans | 98.2 /100 | #97 | Exceptional $58,588 |
| Jordanians | 98.1 /100 | #98 | Exceptional $58,500 |
| Immigrants | Poland | 98.0 /100 | #99 | Exceptional $58,452 |
| Assyrians/Chaldeans/Syriacs | 97.9 /100 | #100 | Exceptional $58,437 |
| Immigrants | Brazil | 97.7 /100 | #101 | Exceptional $58,324 |
| Syrians | 97.4 /100 | #102 | Exceptional $58,187 |
| Poles | 97.3 /100 | #103 | Exceptional $58,139 |
| Armenians | 97.3 /100 | #104 | Exceptional $58,134 |
| Immigrants | Western Asia | 97.3 /100 | #105 | Exceptional $58,131 |
| Immigrants | Northern Africa | 96.9 /100 | #106 | Exceptional $58,008 |
| Serbians | 96.8 /100 | #107 | Exceptional $57,975 |
| Immigrants | Uzbekistan | 96.7 /100 | #108 | Exceptional $57,941 |
Demographics Similar to Pennsylvania Germans by Median Male Earnings
In terms of median male earnings, the demographic groups most similar to Pennsylvania Germans are Immigrants from Western Africa ($50,940, a difference of 0.12%), Immigrants from Barbados ($50,795, a difference of 0.16%), Malaysian ($50,772, a difference of 0.21%), American ($50,761, a difference of 0.23%), and West Indian ($50,682, a difference of 0.39%).
| Demographics | Rating | Rank | Median Male Earnings |
| Immigrants | Trinidad and Tobago | 4.5 /100 | #229 | Tragic $51,376 |
| Immigrants | Nigeria | 4.2 /100 | #230 | Tragic $51,310 |
| Barbadians | 3.9 /100 | #231 | Tragic $51,236 |
| Sudanese | 3.9 /100 | #232 | Tragic $51,216 |
| Aleuts | 3.7 /100 | #233 | Tragic $51,168 |
| Cape Verdeans | 3.5 /100 | #234 | Tragic $51,103 |
| Immigrants | Western Africa | 3.0 /100 | #235 | Tragic $50,940 |
| Pennsylvania Germans | 2.8 /100 | #236 | Tragic $50,878 |
| Immigrants | Barbados | 2.6 /100 | #237 | Tragic $50,795 |
| Malaysians | 2.5 /100 | #238 | Tragic $50,772 |
| Americans | 2.5 /100 | #239 | Tragic $50,761 |
| West Indians | 2.3 /100 | #240 | Tragic $50,682 |
| Immigrants | St. Vincent and the Grenadines | 2.3 /100 | #241 | Tragic $50,665 |
| Guyanese | 2.2 /100 | #242 | Tragic $50,613 |
| French American Indians | 2.2 /100 | #243 | Tragic $50,611 |