Immigrants from Bosnia and Herzegovina vs Immigrants from Latvia Births to Unmarried Women
COMPARE
Immigrants from Bosnia and Herzegovina
Immigrants from Latvia
Births to Unmarried Women
Births to Unmarried Women Comparison
Immigrants from Bosnia and Herzegovina
Immigrants from Latvia
30.3%
BIRTHS TO UNMARRIED WOMEN
85.7/ 100
METRIC RATING
130th/ 347
METRIC RANK
29.1%
BIRTHS TO UNMARRIED WOMEN
96.8/ 100
METRIC RATING
90th/ 347
METRIC RANK
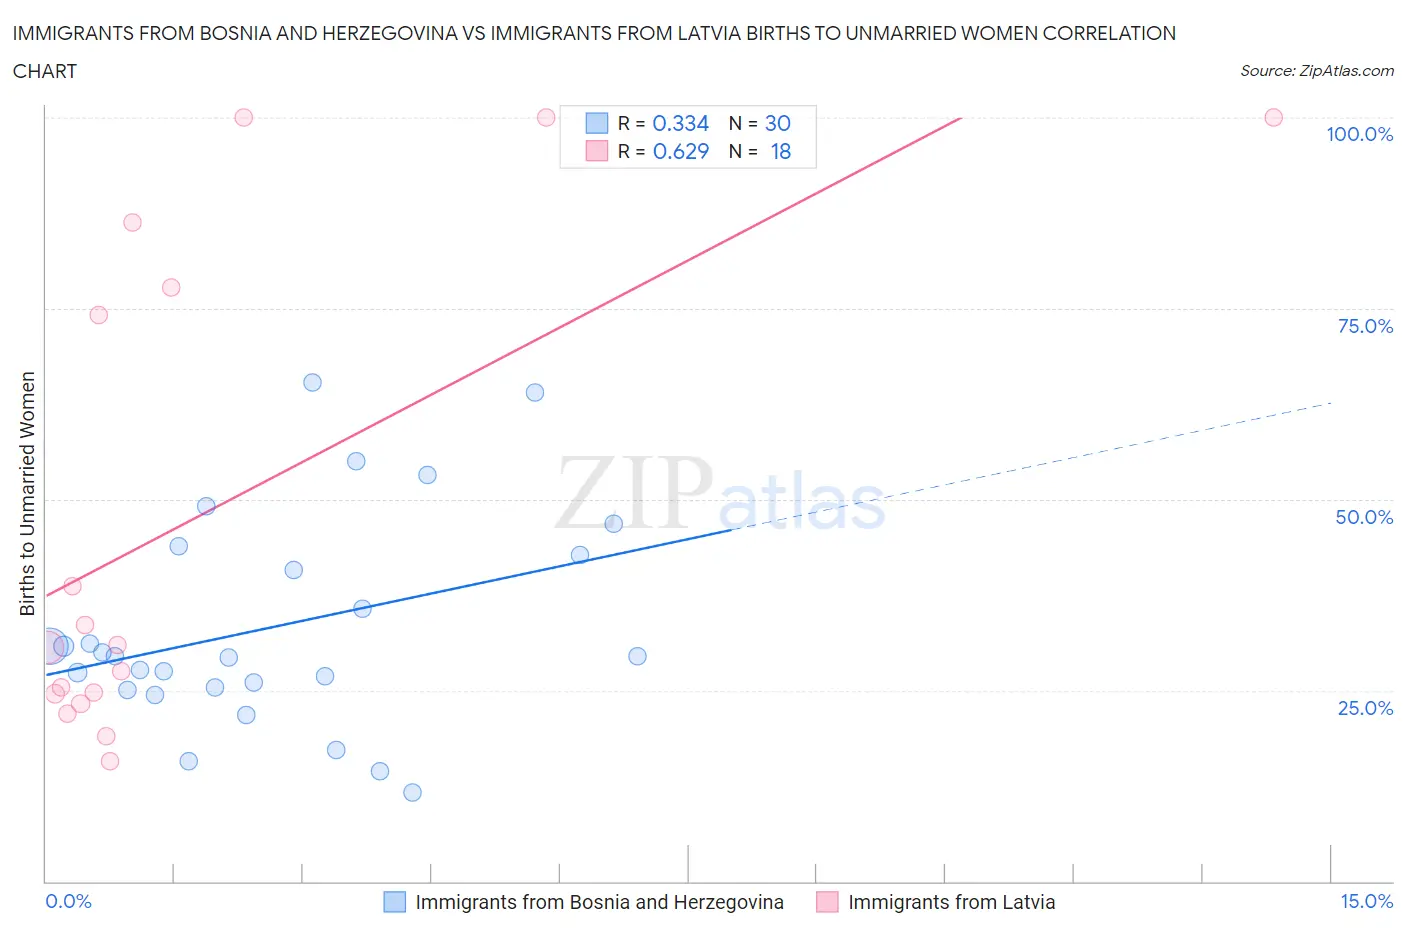
Immigrants from Bosnia and Herzegovina vs Immigrants from Latvia Births to Unmarried Women Correlation Chart
The statistical analysis conducted on geographies consisting of 151,670,112 people shows a mild positive correlation between the proportion of Immigrants from Bosnia and Herzegovina and percentage of births to unmarried women in the United States with a correlation coefficient (R) of 0.334 and weighted average of 30.3%. Similarly, the statistical analysis conducted on geographies consisting of 109,179,125 people shows a significant positive correlation between the proportion of Immigrants from Latvia and percentage of births to unmarried women in the United States with a correlation coefficient (R) of 0.629 and weighted average of 29.1%, a difference of 4.2%.
Births to Unmarried Women Correlation Summary
| Measurement | Immigrants from Bosnia and Herzegovina | Immigrants from Latvia |
| Minimum | 11.7% | 15.8% |
| Maximum | 65.3% | 100.0% |
| Range | 53.6% | 84.2% |
| Mean | 33.3% | 47.4% |
| Median | 29.5% | 30.8% |
| Interquartile 25% (IQ1) | 25.3% | 24.5% |
| Interquartile 75% (IQ3) | 42.7% | 77.8% |
| Interquartile Range (IQR) | 17.4% | 53.3% |
| Standard Deviation (Sample) | 13.8% | 31.8% |
| Standard Deviation (Population) | 13.6% | 30.9% |
Similar Demographics by Births to Unmarried Women
Demographics Similar to Immigrants from Bosnia and Herzegovina by Births to Unmarried Women
In terms of births to unmarried women, the demographic groups most similar to Immigrants from Bosnia and Herzegovina are Immigrants from Spain (30.3%, a difference of 0.010%), Immigrants from Zimbabwe (30.3%, a difference of 0.010%), Icelander (30.3%, a difference of 0.050%), New Zealander (30.3%, a difference of 0.050%), and Immigrants from Morocco (30.4%, a difference of 0.090%).
| Demographics | Rating | Rank | Births to Unmarried Women |
| Syrians | 88.2 /100 | #123 | Excellent 30.2% |
| Croatians | 88.0 /100 | #124 | Excellent 30.2% |
| Vietnamese | 87.7 /100 | #125 | Excellent 30.2% |
| Europeans | 87.2 /100 | #126 | Excellent 30.2% |
| Chinese | 87.1 /100 | #127 | Excellent 30.2% |
| Icelanders | 86.0 /100 | #128 | Excellent 30.3% |
| Immigrants | Spain | 85.8 /100 | #129 | Excellent 30.3% |
| Immigrants | Bosnia and Herzegovina | 85.7 /100 | #130 | Excellent 30.3% |
| Immigrants | Zimbabwe | 85.7 /100 | #131 | Excellent 30.3% |
| New Zealanders | 85.5 /100 | #132 | Excellent 30.3% |
| Immigrants | Morocco | 85.2 /100 | #133 | Excellent 30.4% |
| Immigrants | South Eastern Asia | 85.2 /100 | #134 | Excellent 30.4% |
| Brazilians | 84.8 /100 | #135 | Excellent 30.4% |
| Immigrants | Scotland | 84.6 /100 | #136 | Excellent 30.4% |
| Immigrants | Philippines | 83.9 /100 | #137 | Excellent 30.4% |
Demographics Similar to Immigrants from Latvia by Births to Unmarried Women
In terms of births to unmarried women, the demographic groups most similar to Immigrants from Latvia are Immigrants from Saudi Arabia (29.1%, a difference of 0.16%), Immigrants from Fiji (29.2%, a difference of 0.21%), Arab (29.2%, a difference of 0.25%), Estonian (29.2%, a difference of 0.29%), and Ukrainian (29.2%, a difference of 0.41%).
| Demographics | Rating | Rank | Births to Unmarried Women |
| Immigrants | Kuwait | 98.0 /100 | #83 | Exceptional 28.8% |
| Immigrants | Poland | 97.6 /100 | #84 | Exceptional 28.9% |
| Sri Lankans | 97.5 /100 | #85 | Exceptional 28.9% |
| Immigrants | Jordan | 97.4 /100 | #86 | Exceptional 29.0% |
| Taiwanese | 97.3 /100 | #87 | Exceptional 29.0% |
| Immigrants | France | 97.3 /100 | #88 | Exceptional 29.0% |
| Immigrants | Saudi Arabia | 97.0 /100 | #89 | Exceptional 29.1% |
| Immigrants | Latvia | 96.8 /100 | #90 | Exceptional 29.1% |
| Immigrants | Fiji | 96.6 /100 | #91 | Exceptional 29.2% |
| Arabs | 96.5 /100 | #92 | Exceptional 29.2% |
| Estonians | 96.5 /100 | #93 | Exceptional 29.2% |
| Ukrainians | 96.3 /100 | #94 | Exceptional 29.2% |
| Immigrants | Vietnam | 96.1 /100 | #95 | Exceptional 29.3% |
| Norwegians | 95.8 /100 | #96 | Exceptional 29.3% |
| Immigrants | South Africa | 95.7 /100 | #97 | Exceptional 29.3% |