Immigrants from Bolivia vs Mexican Family Poverty
COMPARE
Immigrants from Bolivia
Mexican
Family Poverty
Family Poverty Comparison
Immigrants from Bolivia
Mexicans
7.7%
FAMILY POVERTY
98.9/ 100
METRIC RATING
49th/ 347
METRIC RANK
11.8%
FAMILY POVERTY
0.0/ 100
METRIC RATING
305th/ 347
METRIC RANK
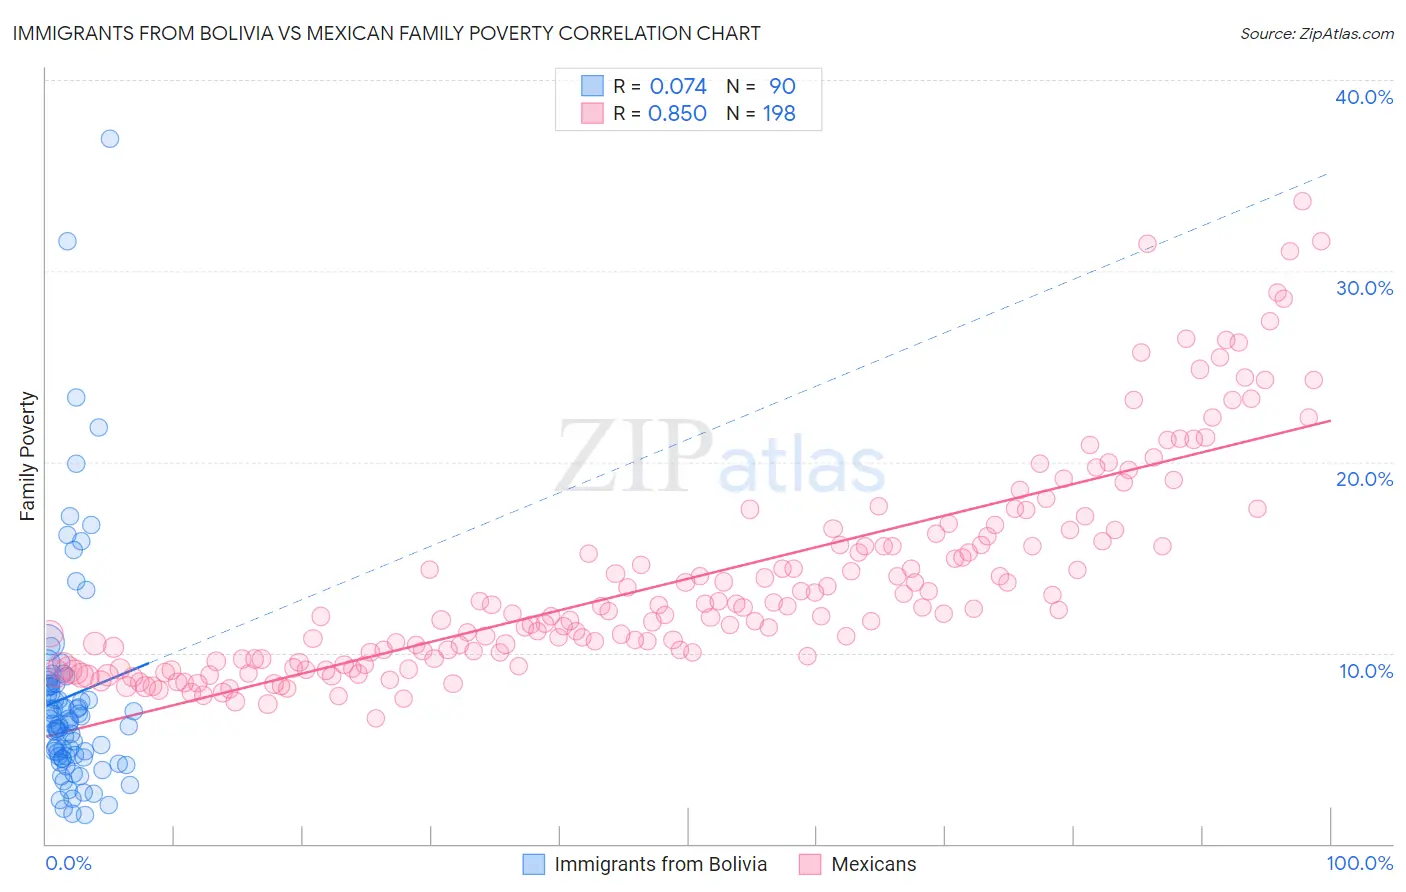
Immigrants from Bolivia vs Mexican Family Poverty Correlation Chart
The statistical analysis conducted on geographies consisting of 158,596,723 people shows a slight positive correlation between the proportion of Immigrants from Bolivia and poverty level among families in the United States with a correlation coefficient (R) of 0.074 and weighted average of 7.7%. Similarly, the statistical analysis conducted on geographies consisting of 561,352,455 people shows a very strong positive correlation between the proportion of Mexicans and poverty level among families in the United States with a correlation coefficient (R) of 0.850 and weighted average of 11.8%, a difference of 53.8%.
Family Poverty Correlation Summary
| Measurement | Immigrants from Bolivia | Mexican |
| Minimum | 1.5% | 6.6% |
| Maximum | 36.9% | 33.6% |
| Range | 35.4% | 27.1% |
| Mean | 7.8% | 13.8% |
| Median | 6.4% | 12.1% |
| Interquartile 25% (IQ1) | 4.6% | 9.7% |
| Interquartile 75% (IQ3) | 8.4% | 15.8% |
| Interquartile Range (IQR) | 3.8% | 6.2% |
| Standard Deviation (Sample) | 5.9% | 5.6% |
| Standard Deviation (Population) | 5.9% | 5.6% |
Similar Demographics by Family Poverty
Demographics Similar to Immigrants from Bolivia by Family Poverty
In terms of family poverty, the demographic groups most similar to Immigrants from Bolivia are Immigrants from North Macedonia (7.7%, a difference of 0.030%), Immigrants from Moldova (7.7%, a difference of 0.18%), Immigrants from Sri Lanka (7.7%, a difference of 0.19%), Immigrants from Czechoslovakia (7.7%, a difference of 0.20%), and Tongan (7.7%, a difference of 0.22%).
| Demographics | Rating | Rank | Family Poverty |
| Scandinavians | 99.1 /100 | #42 | Exceptional 7.6% |
| Immigrants | Austria | 99.1 /100 | #43 | Exceptional 7.6% |
| Germans | 99.0 /100 | #44 | Exceptional 7.7% |
| Okinawans | 98.9 /100 | #45 | Exceptional 7.7% |
| Tongans | 98.9 /100 | #46 | Exceptional 7.7% |
| Immigrants | Czechoslovakia | 98.9 /100 | #47 | Exceptional 7.7% |
| Immigrants | Sri Lanka | 98.9 /100 | #48 | Exceptional 7.7% |
| Immigrants | Bolivia | 98.9 /100 | #49 | Exceptional 7.7% |
| Immigrants | North Macedonia | 98.9 /100 | #50 | Exceptional 7.7% |
| Immigrants | Moldova | 98.8 /100 | #51 | Exceptional 7.7% |
| Indians (Asian) | 98.8 /100 | #52 | Exceptional 7.7% |
| Swiss | 98.8 /100 | #53 | Exceptional 7.7% |
| Immigrants | Sweden | 98.8 /100 | #54 | Exceptional 7.7% |
| Immigrants | Eastern Asia | 98.7 /100 | #55 | Exceptional 7.7% |
| Immigrants | Serbia | 98.7 /100 | #56 | Exceptional 7.7% |
Demographics Similar to Mexicans by Family Poverty
In terms of family poverty, the demographic groups most similar to Mexicans are Immigrants from Latin America (11.8%, a difference of 0.18%), African (11.8%, a difference of 0.37%), Cajun (11.9%, a difference of 0.56%), Immigrants from Congo (11.9%, a difference of 0.67%), and Seminole (11.9%, a difference of 0.73%).
| Demographics | Rating | Rank | Family Poverty |
| Immigrants | Senegal | 0.0 /100 | #298 | Tragic 11.7% |
| Dutch West Indians | 0.0 /100 | #299 | Tragic 11.7% |
| Immigrants | Bangladesh | 0.0 /100 | #300 | Tragic 11.7% |
| Bahamians | 0.0 /100 | #301 | Tragic 11.7% |
| Guatemalans | 0.0 /100 | #302 | Tragic 11.7% |
| Africans | 0.0 /100 | #303 | Tragic 11.8% |
| Immigrants | Latin America | 0.0 /100 | #304 | Tragic 11.8% |
| Mexicans | 0.0 /100 | #305 | Tragic 11.8% |
| Cajuns | 0.0 /100 | #306 | Tragic 11.9% |
| Immigrants | Congo | 0.0 /100 | #307 | Tragic 11.9% |
| Seminole | 0.0 /100 | #308 | Tragic 11.9% |
| Hispanics or Latinos | 0.0 /100 | #309 | Tragic 12.0% |
| Immigrants | Guatemala | 0.0 /100 | #310 | Tragic 12.0% |
| Ute | 0.0 /100 | #311 | Tragic 12.1% |
| Immigrants | Central America | 0.0 /100 | #312 | Tragic 12.1% |