Immigrants from Belarus vs Immigrants from Australia Single Male Poverty
COMPARE
Immigrants from Belarus
Immigrants from Australia
Single Male Poverty
Single Male Poverty Comparison
Immigrants from Belarus
Immigrants from Australia
11.8%
SINGLE MALE POVERTY
99.7/ 100
METRIC RATING
63rd/ 347
METRIC RANK
12.2%
SINGLE MALE POVERTY
97.1/ 100
METRIC RATING
100th/ 347
METRIC RANK
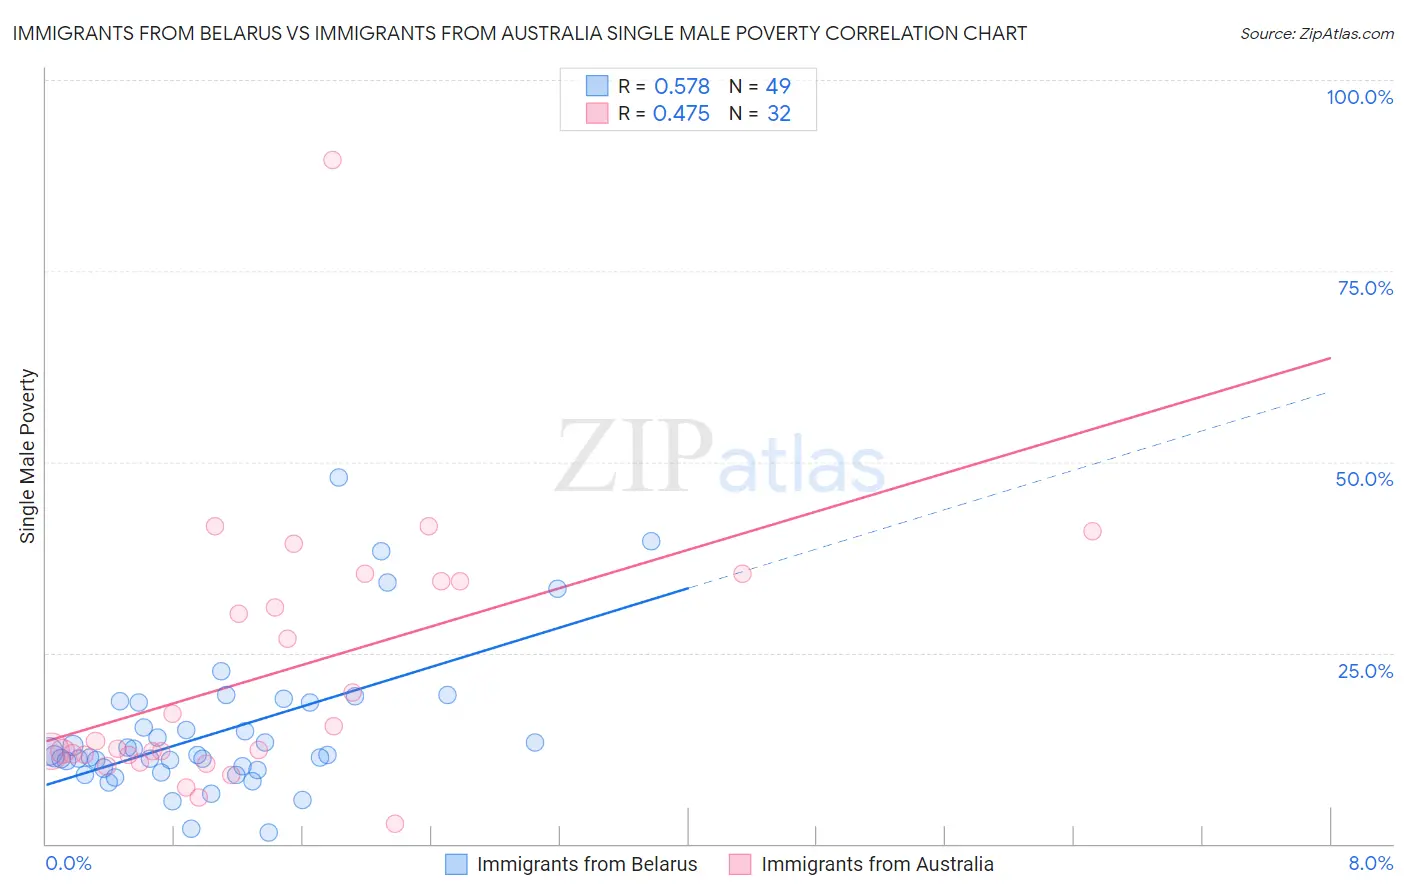
Immigrants from Belarus vs Immigrants from Australia Single Male Poverty Correlation Chart
The statistical analysis conducted on geographies consisting of 138,467,710 people shows a substantial positive correlation between the proportion of Immigrants from Belarus and poverty level among single males in the United States with a correlation coefficient (R) of 0.578 and weighted average of 11.8%. Similarly, the statistical analysis conducted on geographies consisting of 206,372,420 people shows a moderate positive correlation between the proportion of Immigrants from Australia and poverty level among single males in the United States with a correlation coefficient (R) of 0.475 and weighted average of 12.2%, a difference of 3.2%.
Single Male Poverty Correlation Summary
| Measurement | Immigrants from Belarus | Immigrants from Australia |
| Minimum | 1.5% | 2.6% |
| Maximum | 48.0% | 89.5% |
| Range | 46.5% | 86.9% |
| Mean | 14.7% | 22.2% |
| Median | 11.6% | 12.9% |
| Interquartile 25% (IQ1) | 9.8% | 11.6% |
| Interquartile 75% (IQ3) | 18.5% | 34.4% |
| Interquartile Range (IQR) | 8.8% | 22.8% |
| Standard Deviation (Sample) | 9.4% | 17.3% |
| Standard Deviation (Population) | 9.3% | 17.0% |
Similar Demographics by Single Male Poverty
Demographics Similar to Immigrants from Belarus by Single Male Poverty
In terms of single male poverty, the demographic groups most similar to Immigrants from Belarus are Immigrants from Sri Lanka (11.8%, a difference of 0.050%), Immigrants from Eastern Europe (11.8%, a difference of 0.14%), Laotian (11.9%, a difference of 0.23%), Immigrants from Uruguay (11.9%, a difference of 0.23%), and Immigrants from Ukraine (11.9%, a difference of 0.25%).
| Demographics | Rating | Rank | Single Male Poverty |
| Burmese | 99.8 /100 | #56 | Exceptional 11.7% |
| Immigrants | Romania | 99.8 /100 | #57 | Exceptional 11.7% |
| Immigrants | Brazil | 99.8 /100 | #58 | Exceptional 11.7% |
| Brazilians | 99.8 /100 | #59 | Exceptional 11.8% |
| Peruvians | 99.8 /100 | #60 | Exceptional 11.8% |
| Cambodians | 99.8 /100 | #61 | Exceptional 11.8% |
| Immigrants | Sri Lanka | 99.7 /100 | #62 | Exceptional 11.8% |
| Immigrants | Belarus | 99.7 /100 | #63 | Exceptional 11.8% |
| Immigrants | Eastern Europe | 99.6 /100 | #64 | Exceptional 11.8% |
| Laotians | 99.6 /100 | #65 | Exceptional 11.9% |
| Immigrants | Uruguay | 99.6 /100 | #66 | Exceptional 11.9% |
| Immigrants | Ukraine | 99.6 /100 | #67 | Exceptional 11.9% |
| Immigrants | Croatia | 99.6 /100 | #68 | Exceptional 11.9% |
| Immigrants | Russia | 99.6 /100 | #69 | Exceptional 11.9% |
| Immigrants | Nepal | 99.6 /100 | #70 | Exceptional 11.9% |
Demographics Similar to Immigrants from Australia by Single Male Poverty
In terms of single male poverty, the demographic groups most similar to Immigrants from Australia are Immigrants from Latvia (12.2%, a difference of 0.030%), Immigrants from Europe (12.2%, a difference of 0.040%), Immigrants from Cuba (12.2%, a difference of 0.11%), Guamanian/Chamorro (12.2%, a difference of 0.15%), and Immigrants from Italy (12.2%, a difference of 0.16%).
| Demographics | Rating | Rank | Single Male Poverty |
| Immigrants | Bosnia and Herzegovina | 97.9 /100 | #93 | Exceptional 12.1% |
| Colombians | 97.8 /100 | #94 | Exceptional 12.2% |
| Mongolians | 97.7 /100 | #95 | Exceptional 12.2% |
| Immigrants | Sweden | 97.5 /100 | #96 | Exceptional 12.2% |
| Immigrants | Italy | 97.4 /100 | #97 | Exceptional 12.2% |
| Guamanians/Chamorros | 97.4 /100 | #98 | Exceptional 12.2% |
| Immigrants | Cuba | 97.3 /100 | #99 | Exceptional 12.2% |
| Immigrants | Australia | 97.1 /100 | #100 | Exceptional 12.2% |
| Immigrants | Latvia | 97.0 /100 | #101 | Exceptional 12.2% |
| Immigrants | Europe | 97.0 /100 | #102 | Exceptional 12.2% |
| Immigrants | Armenia | 96.7 /100 | #103 | Exceptional 12.2% |
| Immigrants | Kazakhstan | 96.7 /100 | #104 | Exceptional 12.2% |
| Jordanians | 95.9 /100 | #105 | Exceptional 12.3% |
| Immigrants | Morocco | 95.6 /100 | #106 | Exceptional 12.3% |
| Iraqis | 95.1 /100 | #107 | Exceptional 12.3% |