Immigrants from Bangladesh vs Fijian Female Poverty
COMPARE
Immigrants from Bangladesh
Fijian
Female Poverty
Female Poverty Comparison
Immigrants from Bangladesh
Fijians
16.4%
FEMALE POVERTY
0.0/ 100
METRIC RATING
290th/ 347
METRIC RANK
14.9%
FEMALE POVERTY
1.1/ 100
METRIC RATING
234th/ 347
METRIC RANK
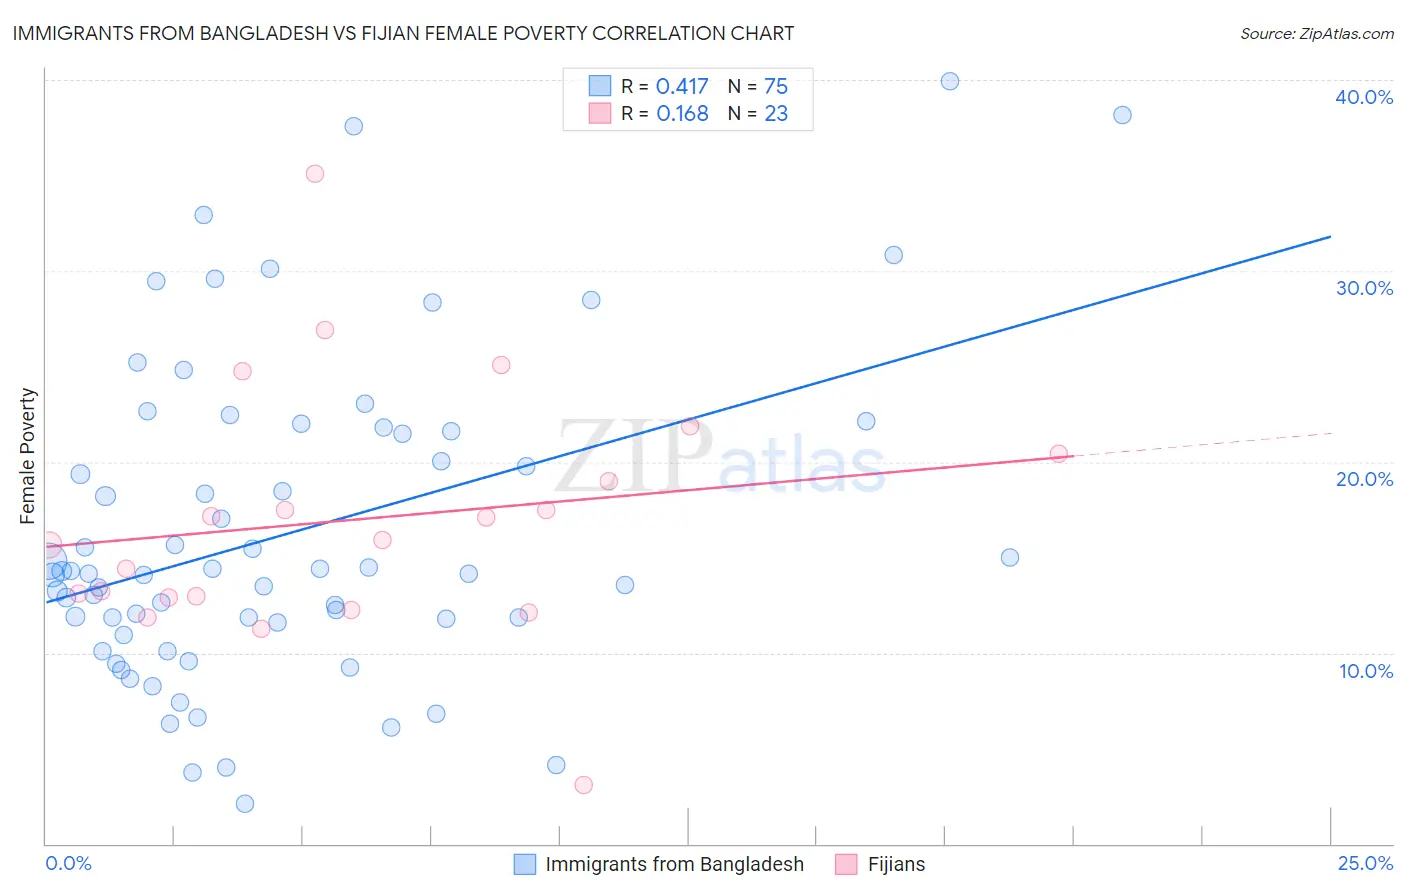
Immigrants from Bangladesh vs Fijian Female Poverty Correlation Chart
The statistical analysis conducted on geographies consisting of 203,545,805 people shows a moderate positive correlation between the proportion of Immigrants from Bangladesh and poverty level among females in the United States with a correlation coefficient (R) of 0.417 and weighted average of 16.4%. Similarly, the statistical analysis conducted on geographies consisting of 55,946,752 people shows a poor positive correlation between the proportion of Fijians and poverty level among females in the United States with a correlation coefficient (R) of 0.168 and weighted average of 14.9%, a difference of 10.1%.
Female Poverty Correlation Summary
| Measurement | Immigrants from Bangladesh | Fijian |
| Minimum | 2.1% | 3.1% |
| Maximum | 39.9% | 35.1% |
| Range | 37.8% | 32.0% |
| Mean | 16.3% | 17.0% |
| Median | 14.2% | 15.9% |
| Interquartile 25% (IQ1) | 11.6% | 12.9% |
| Interquartile 75% (IQ3) | 21.6% | 20.4% |
| Interquartile Range (IQR) | 10.0% | 7.6% |
| Standard Deviation (Sample) | 8.3% | 6.6% |
| Standard Deviation (Population) | 8.3% | 6.5% |
Similar Demographics by Female Poverty
Demographics Similar to Immigrants from Bangladesh by Female Poverty
In terms of female poverty, the demographic groups most similar to Immigrants from Bangladesh are Yaqui (16.4%, a difference of 0.17%), Immigrants from Zaire (16.4%, a difference of 0.18%), Blackfeet (16.4%, a difference of 0.19%), Indonesian (16.4%, a difference of 0.20%), and Immigrants from Latin America (16.4%, a difference of 0.23%).
| Demographics | Rating | Rank | Female Poverty |
| Immigrants | Cuba | 0.0 /100 | #283 | Tragic 16.1% |
| Spanish Americans | 0.0 /100 | #284 | Tragic 16.2% |
| Comanche | 0.0 /100 | #285 | Tragic 16.2% |
| Inupiat | 0.0 /100 | #286 | Tragic 16.2% |
| Immigrants | Belize | 0.0 /100 | #287 | Tragic 16.3% |
| Indonesians | 0.0 /100 | #288 | Tragic 16.4% |
| Blackfeet | 0.0 /100 | #289 | Tragic 16.4% |
| Immigrants | Bangladesh | 0.0 /100 | #290 | Tragic 16.4% |
| Yaqui | 0.0 /100 | #291 | Tragic 16.4% |
| Immigrants | Zaire | 0.0 /100 | #292 | Tragic 16.4% |
| Immigrants | Latin America | 0.0 /100 | #293 | Tragic 16.4% |
| Immigrants | Cabo Verde | 0.0 /100 | #294 | Tragic 16.4% |
| Senegalese | 0.0 /100 | #295 | Tragic 16.5% |
| Immigrants | Senegal | 0.0 /100 | #296 | Tragic 16.5% |
| Mexicans | 0.0 /100 | #297 | Tragic 16.5% |
Demographics Similar to Fijians by Female Poverty
In terms of female poverty, the demographic groups most similar to Fijians are Immigrants from Laos (15.0%, a difference of 0.44%), Immigrants from Saudi Arabia (14.8%, a difference of 0.52%), Osage (14.8%, a difference of 0.62%), Nigerian (14.8%, a difference of 0.93%), and Alaska Native (14.7%, a difference of 1.0%).
| Demographics | Rating | Rank | Female Poverty |
| Immigrants | Nigeria | 2.1 /100 | #227 | Tragic 14.7% |
| German Russians | 2.0 /100 | #228 | Tragic 14.7% |
| Ghanaians | 1.9 /100 | #229 | Tragic 14.7% |
| Alaska Natives | 1.8 /100 | #230 | Tragic 14.7% |
| Nigerians | 1.7 /100 | #231 | Tragic 14.8% |
| Osage | 1.5 /100 | #232 | Tragic 14.8% |
| Immigrants | Saudi Arabia | 1.4 /100 | #233 | Tragic 14.8% |
| Fijians | 1.1 /100 | #234 | Tragic 14.9% |
| Immigrants | Laos | 0.9 /100 | #235 | Tragic 15.0% |
| Cree | 0.7 /100 | #236 | Tragic 15.1% |
| French American Indians | 0.6 /100 | #237 | Tragic 15.1% |
| Immigrants | Armenia | 0.6 /100 | #238 | Tragic 15.1% |
| Immigrants | Middle Africa | 0.5 /100 | #239 | Tragic 15.2% |
| Sudanese | 0.5 /100 | #240 | Tragic 15.2% |
| Immigrants | Sudan | 0.4 /100 | #241 | Tragic 15.2% |