Immigrants from Brazil vs Fijian Female Poverty
COMPARE
Immigrants from Brazil
Fijian
Female Poverty
Female Poverty Comparison
Immigrants from Brazil
Fijians
12.8%
FEMALE POVERTY
87.9/ 100
METRIC RATING
129th/ 347
METRIC RANK
14.9%
FEMALE POVERTY
1.1/ 100
METRIC RATING
234th/ 347
METRIC RANK
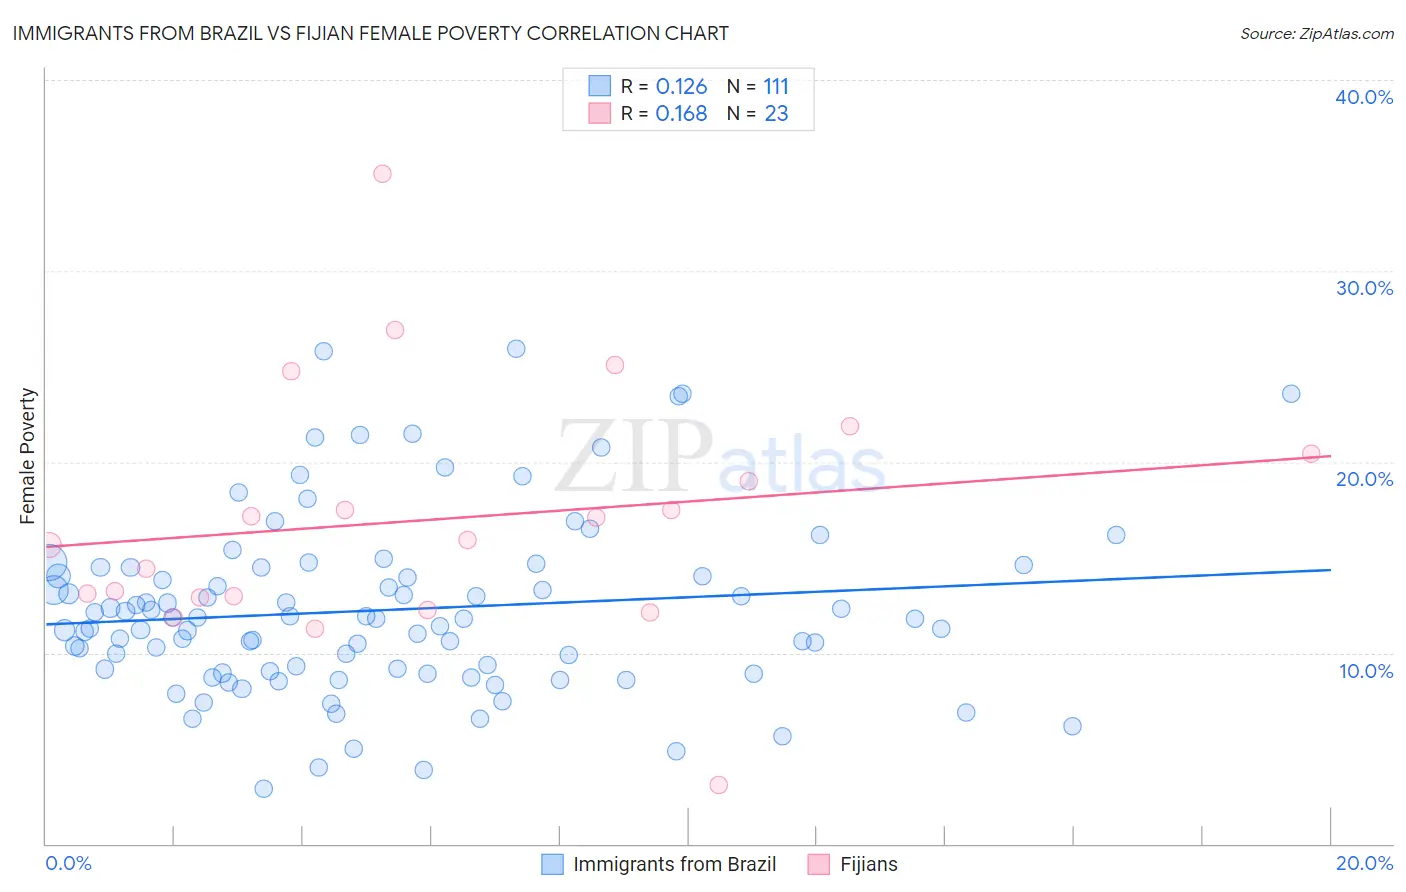
Immigrants from Brazil vs Fijian Female Poverty Correlation Chart
The statistical analysis conducted on geographies consisting of 342,799,416 people shows a poor positive correlation between the proportion of Immigrants from Brazil and poverty level among females in the United States with a correlation coefficient (R) of 0.126 and weighted average of 12.8%. Similarly, the statistical analysis conducted on geographies consisting of 55,946,752 people shows a poor positive correlation between the proportion of Fijians and poverty level among females in the United States with a correlation coefficient (R) of 0.168 and weighted average of 14.9%, a difference of 16.4%.
Female Poverty Correlation Summary
| Measurement | Immigrants from Brazil | Fijian |
| Minimum | 2.9% | 3.1% |
| Maximum | 25.9% | 35.1% |
| Range | 23.1% | 32.0% |
| Mean | 12.2% | 17.0% |
| Median | 11.8% | 15.9% |
| Interquartile 25% (IQ1) | 9.0% | 12.9% |
| Interquartile 75% (IQ3) | 14.5% | 20.4% |
| Interquartile Range (IQR) | 5.4% | 7.6% |
| Standard Deviation (Sample) | 4.6% | 6.6% |
| Standard Deviation (Population) | 4.6% | 6.5% |
Similar Demographics by Female Poverty
Demographics Similar to Immigrants from Brazil by Female Poverty
In terms of female poverty, the demographic groups most similar to Immigrants from Brazil are Immigrants from Belarus (12.8%, a difference of 0.070%), South African (12.8%, a difference of 0.11%), Immigrants from Vietnam (12.8%, a difference of 0.19%), Immigrants from Ukraine (12.8%, a difference of 0.22%), and Immigrants from Argentina (12.8%, a difference of 0.22%).
| Demographics | Rating | Rank | Female Poverty |
| French Canadians | 90.2 /100 | #122 | Exceptional 12.7% |
| Immigrants | South Eastern Asia | 89.9 /100 | #123 | Excellent 12.7% |
| Immigrants | Norway | 89.3 /100 | #124 | Excellent 12.8% |
| Argentineans | 89.1 /100 | #125 | Excellent 12.8% |
| Immigrants | Ukraine | 88.8 /100 | #126 | Excellent 12.8% |
| South Africans | 88.4 /100 | #127 | Excellent 12.8% |
| Immigrants | Belarus | 88.2 /100 | #128 | Excellent 12.8% |
| Immigrants | Brazil | 87.9 /100 | #129 | Excellent 12.8% |
| Immigrants | Vietnam | 87.1 /100 | #130 | Excellent 12.8% |
| Immigrants | Argentina | 87.0 /100 | #131 | Excellent 12.8% |
| Immigrants | Jordan | 86.9 /100 | #132 | Excellent 12.8% |
| Immigrants | Western Europe | 86.6 /100 | #133 | Excellent 12.8% |
| Immigrants | Switzerland | 85.8 /100 | #134 | Excellent 12.9% |
| French | 85.6 /100 | #135 | Excellent 12.9% |
| Peruvians | 85.2 /100 | #136 | Excellent 12.9% |
Demographics Similar to Fijians by Female Poverty
In terms of female poverty, the demographic groups most similar to Fijians are Immigrants from Laos (15.0%, a difference of 0.44%), Immigrants from Saudi Arabia (14.8%, a difference of 0.52%), Osage (14.8%, a difference of 0.62%), Nigerian (14.8%, a difference of 0.93%), and Alaska Native (14.7%, a difference of 1.0%).
| Demographics | Rating | Rank | Female Poverty |
| Immigrants | Nigeria | 2.1 /100 | #227 | Tragic 14.7% |
| German Russians | 2.0 /100 | #228 | Tragic 14.7% |
| Ghanaians | 1.9 /100 | #229 | Tragic 14.7% |
| Alaska Natives | 1.8 /100 | #230 | Tragic 14.7% |
| Nigerians | 1.7 /100 | #231 | Tragic 14.8% |
| Osage | 1.5 /100 | #232 | Tragic 14.8% |
| Immigrants | Saudi Arabia | 1.4 /100 | #233 | Tragic 14.8% |
| Fijians | 1.1 /100 | #234 | Tragic 14.9% |
| Immigrants | Laos | 0.9 /100 | #235 | Tragic 15.0% |
| Cree | 0.7 /100 | #236 | Tragic 15.1% |
| French American Indians | 0.6 /100 | #237 | Tragic 15.1% |
| Immigrants | Armenia | 0.6 /100 | #238 | Tragic 15.1% |
| Immigrants | Middle Africa | 0.5 /100 | #239 | Tragic 15.2% |
| Sudanese | 0.5 /100 | #240 | Tragic 15.2% |
| Immigrants | Sudan | 0.4 /100 | #241 | Tragic 15.2% |