Immigrants from Bangladesh vs Immigrants from Mexico Female Poverty
COMPARE
Immigrants from Bangladesh
Immigrants from Mexico
Female Poverty
Female Poverty Comparison
Immigrants from Bangladesh
Immigrants from Mexico
16.4%
FEMALE POVERTY
0.0/ 100
METRIC RATING
290th/ 347
METRIC RANK
17.0%
FEMALE POVERTY
0.0/ 100
METRIC RATING
309th/ 347
METRIC RANK
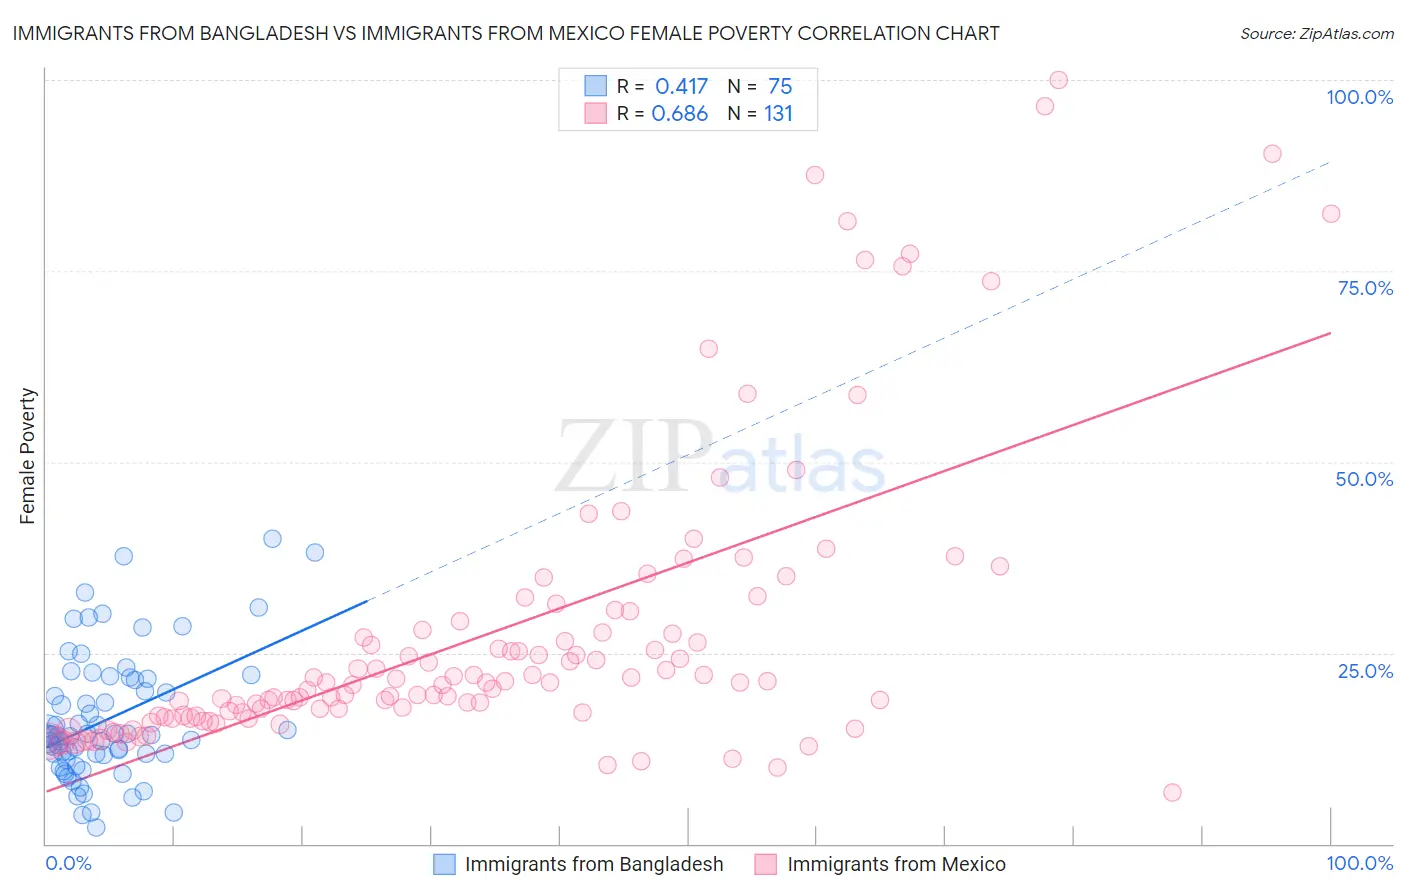
Immigrants from Bangladesh vs Immigrants from Mexico Female Poverty Correlation Chart
The statistical analysis conducted on geographies consisting of 203,545,805 people shows a moderate positive correlation between the proportion of Immigrants from Bangladesh and poverty level among females in the United States with a correlation coefficient (R) of 0.417 and weighted average of 16.4%. Similarly, the statistical analysis conducted on geographies consisting of 513,228,632 people shows a significant positive correlation between the proportion of Immigrants from Mexico and poverty level among females in the United States with a correlation coefficient (R) of 0.686 and weighted average of 17.0%, a difference of 3.5%.
Female Poverty Correlation Summary
| Measurement | Immigrants from Bangladesh | Immigrants from Mexico |
| Minimum | 2.1% | 6.7% |
| Maximum | 39.9% | 100.0% |
| Range | 37.8% | 93.3% |
| Mean | 16.3% | 27.4% |
| Median | 14.2% | 21.1% |
| Interquartile 25% (IQ1) | 11.6% | 16.7% |
| Interquartile 75% (IQ3) | 21.6% | 28.0% |
| Interquartile Range (IQR) | 10.0% | 11.3% |
| Standard Deviation (Sample) | 8.3% | 19.2% |
| Standard Deviation (Population) | 8.3% | 19.1% |
Demographics Similar to Immigrants from Bangladesh and Immigrants from Mexico by Female Poverty
In terms of female poverty, the demographic groups most similar to Immigrants from Bangladesh are Yaqui (16.4%, a difference of 0.17%), Immigrants from Zaire (16.4%, a difference of 0.18%), Blackfeet (16.4%, a difference of 0.19%), Immigrants from Latin America (16.4%, a difference of 0.23%), and Immigrants from Cabo Verde (16.4%, a difference of 0.27%). Similarly, the demographic groups most similar to Immigrants from Mexico are African (16.9%, a difference of 0.39%), Seminole (16.9%, a difference of 0.45%), Immigrants from Caribbean (16.9%, a difference of 0.57%), Immigrants from Grenada (16.8%, a difference of 0.84%), and Immigrants from Central America (16.8%, a difference of 0.85%).
| Demographics | Rating | Rank | Female Poverty |
| Blackfeet | 0.0 /100 | #289 | Tragic 16.4% |
| Immigrants | Bangladesh | 0.0 /100 | #290 | Tragic 16.4% |
| Yaqui | 0.0 /100 | #291 | Tragic 16.4% |
| Immigrants | Zaire | 0.0 /100 | #292 | Tragic 16.4% |
| Immigrants | Latin America | 0.0 /100 | #293 | Tragic 16.4% |
| Immigrants | Cabo Verde | 0.0 /100 | #294 | Tragic 16.4% |
| Senegalese | 0.0 /100 | #295 | Tragic 16.5% |
| Immigrants | Senegal | 0.0 /100 | #296 | Tragic 16.5% |
| Mexicans | 0.0 /100 | #297 | Tragic 16.5% |
| Somalis | 0.0 /100 | #298 | Tragic 16.6% |
| Hispanics or Latinos | 0.0 /100 | #299 | Tragic 16.6% |
| Bahamians | 0.0 /100 | #300 | Tragic 16.6% |
| Guatemalans | 0.0 /100 | #301 | Tragic 16.7% |
| Chippewa | 0.0 /100 | #302 | Tragic 16.7% |
| Choctaw | 0.0 /100 | #303 | Tragic 16.8% |
| Immigrants | Central America | 0.0 /100 | #304 | Tragic 16.8% |
| Immigrants | Grenada | 0.0 /100 | #305 | Tragic 16.8% |
| Immigrants | Caribbean | 0.0 /100 | #306 | Tragic 16.9% |
| Seminole | 0.0 /100 | #307 | Tragic 16.9% |
| Africans | 0.0 /100 | #308 | Tragic 16.9% |
| Immigrants | Mexico | 0.0 /100 | #309 | Tragic 17.0% |