Immigrants from the Azores vs Immigrants from Sweden Child Poverty Among Girls Under 16
COMPARE
Immigrants from the Azores
Immigrants from Sweden
Child Poverty Among Girls Under 16
Child Poverty Among Girls Under 16 Comparison
Immigrants from the Azores
Immigrants from Sweden
16.8%
CHILD POVERTY AMONG GIRLS UNDER 16
31.3/ 100
METRIC RATING
191st/ 347
METRIC RANK
14.5%
CHILD POVERTY AMONG GIRLS UNDER 16
98.6/ 100
METRIC RATING
65th/ 347
METRIC RANK
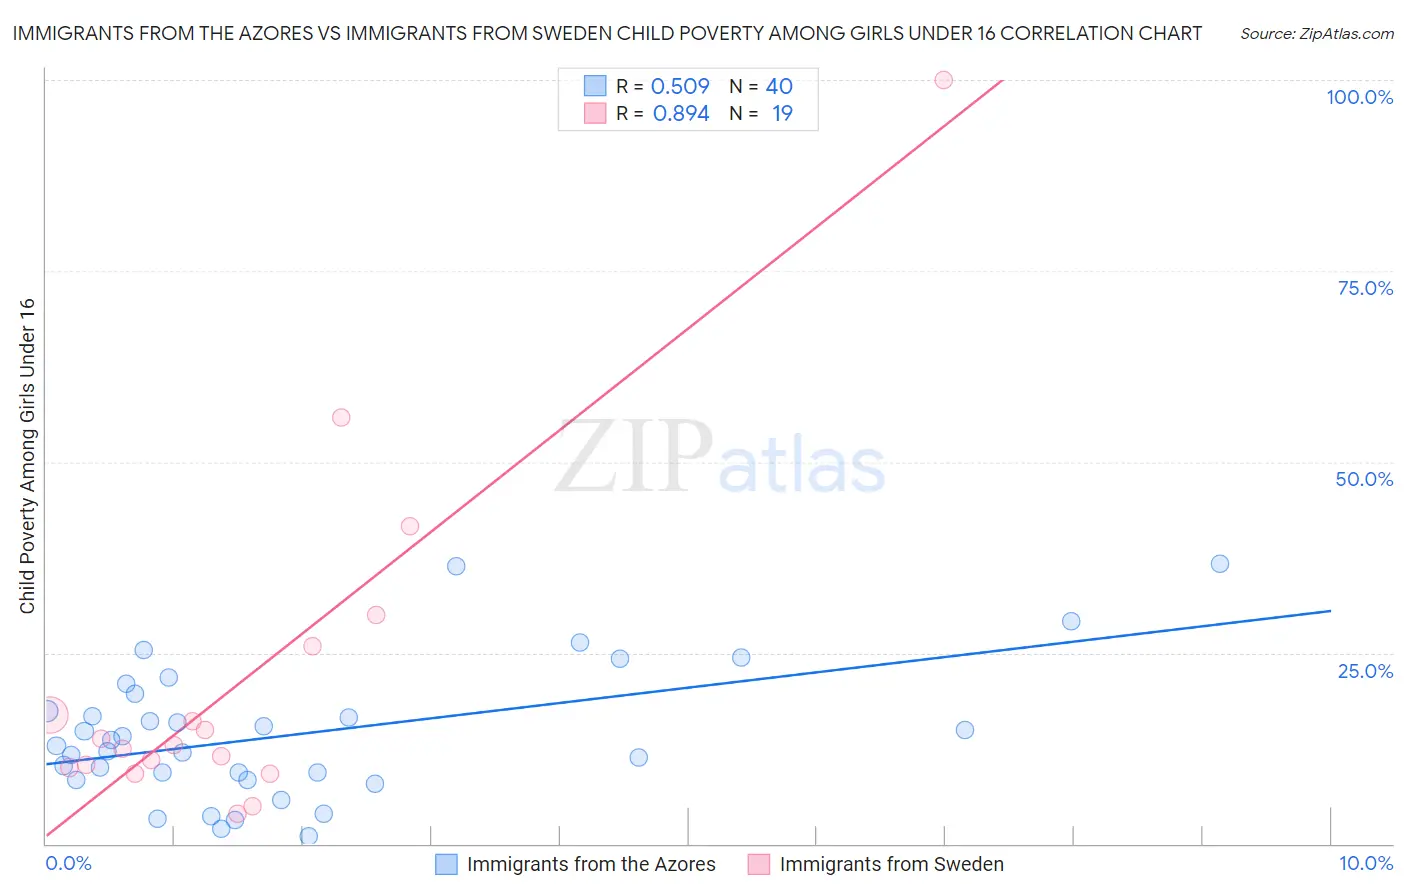
Immigrants from the Azores vs Immigrants from Sweden Child Poverty Among Girls Under 16 Correlation Chart
The statistical analysis conducted on geographies consisting of 45,828,269 people shows a substantial positive correlation between the proportion of Immigrants from the Azores and poverty level among girls under the age of 16 in the United States with a correlation coefficient (R) of 0.509 and weighted average of 16.8%. Similarly, the statistical analysis conducted on geographies consisting of 162,598,010 people shows a very strong positive correlation between the proportion of Immigrants from Sweden and poverty level among girls under the age of 16 in the United States with a correlation coefficient (R) of 0.894 and weighted average of 14.5%, a difference of 16.5%.
Child Poverty Among Girls Under 16 Correlation Summary
| Measurement | Immigrants from the Azores | Immigrants from Sweden |
| Minimum | 0.96% | 3.9% |
| Maximum | 36.6% | 100.0% |
| Range | 35.6% | 96.1% |
| Mean | 14.4% | 21.6% |
| Median | 13.2% | 12.9% |
| Interquartile 25% (IQ1) | 8.8% | 10.0% |
| Interquartile 75% (IQ3) | 18.5% | 25.8% |
| Interquartile Range (IQR) | 9.6% | 15.9% |
| Standard Deviation (Sample) | 8.7% | 23.0% |
| Standard Deviation (Population) | 8.6% | 22.4% |
Similar Demographics by Child Poverty Among Girls Under 16
Demographics Similar to Immigrants from the Azores by Child Poverty Among Girls Under 16
In terms of child poverty among girls under 16, the demographic groups most similar to Immigrants from the Azores are Immigrants from Uganda (16.8%, a difference of 0.010%), Kenyan (16.8%, a difference of 0.12%), Immigrants from Bosnia and Herzegovina (16.8%, a difference of 0.16%), Aleut (16.9%, a difference of 0.35%), and Spanish (16.9%, a difference of 0.37%).
| Demographics | Rating | Rank | Child Poverty Among Girls Under 16 |
| Scotch-Irish | 39.6 /100 | #184 | Fair 16.7% |
| Immigrants | Uruguay | 35.6 /100 | #185 | Fair 16.7% |
| South American Indians | 35.0 /100 | #186 | Fair 16.8% |
| Immigrants | Morocco | 34.6 /100 | #187 | Fair 16.8% |
| Arabs | 34.5 /100 | #188 | Fair 16.8% |
| Immigrants | Bosnia and Herzegovina | 32.5 /100 | #189 | Fair 16.8% |
| Kenyans | 32.3 /100 | #190 | Fair 16.8% |
| Immigrants | Azores | 31.3 /100 | #191 | Fair 16.8% |
| Immigrants | Uganda | 31.3 /100 | #192 | Fair 16.8% |
| Aleuts | 28.7 /100 | #193 | Fair 16.9% |
| Spanish | 28.6 /100 | #194 | Fair 16.9% |
| Immigrants | Costa Rica | 25.6 /100 | #195 | Fair 17.0% |
| Celtics | 25.2 /100 | #196 | Fair 17.0% |
| Spaniards | 24.9 /100 | #197 | Fair 17.0% |
| Immigrants | Lebanon | 22.6 /100 | #198 | Fair 17.1% |
Demographics Similar to Immigrants from Sweden by Child Poverty Among Girls Under 16
In terms of child poverty among girls under 16, the demographic groups most similar to Immigrants from Sweden are Immigrants from Philippines (14.4%, a difference of 0.030%), Immigrants from Europe (14.4%, a difference of 0.14%), Immigrants from Belgium (14.5%, a difference of 0.16%), Scandinavian (14.4%, a difference of 0.19%), and Polish (14.4%, a difference of 0.30%).
| Demographics | Rating | Rank | Child Poverty Among Girls Under 16 |
| Immigrants | Bulgaria | 98.8 /100 | #58 | Exceptional 14.4% |
| Zimbabweans | 98.8 /100 | #59 | Exceptional 14.4% |
| Poles | 98.7 /100 | #60 | Exceptional 14.4% |
| Cambodians | 98.7 /100 | #61 | Exceptional 14.4% |
| Scandinavians | 98.7 /100 | #62 | Exceptional 14.4% |
| Immigrants | Europe | 98.7 /100 | #63 | Exceptional 14.4% |
| Immigrants | Philippines | 98.6 /100 | #64 | Exceptional 14.4% |
| Immigrants | Sweden | 98.6 /100 | #65 | Exceptional 14.5% |
| Immigrants | Belgium | 98.5 /100 | #66 | Exceptional 14.5% |
| Laotians | 98.4 /100 | #67 | Exceptional 14.5% |
| Immigrants | Argentina | 98.3 /100 | #68 | Exceptional 14.6% |
| Immigrants | Poland | 98.2 /100 | #69 | Exceptional 14.6% |
| Europeans | 98.1 /100 | #70 | Exceptional 14.6% |
| Slovenes | 98.1 /100 | #71 | Exceptional 14.6% |
| Immigrants | Netherlands | 98.1 /100 | #72 | Exceptional 14.6% |