Yakama vs Australian Child Poverty Under the Age of 5
COMPARE
Yakama
Australian
Child Poverty Under the Age of 5
Child Poverty Under the Age of 5 Comparison
Yakama
Australians
23.1%
CHILD POVERTY UNDER THE AGE OF 5
0.0/ 100
METRIC RATING
316th/ 347
METRIC RANK
15.5%
CHILD POVERTY UNDER THE AGE OF 5
98.0/ 100
METRIC RATING
79th/ 347
METRIC RANK
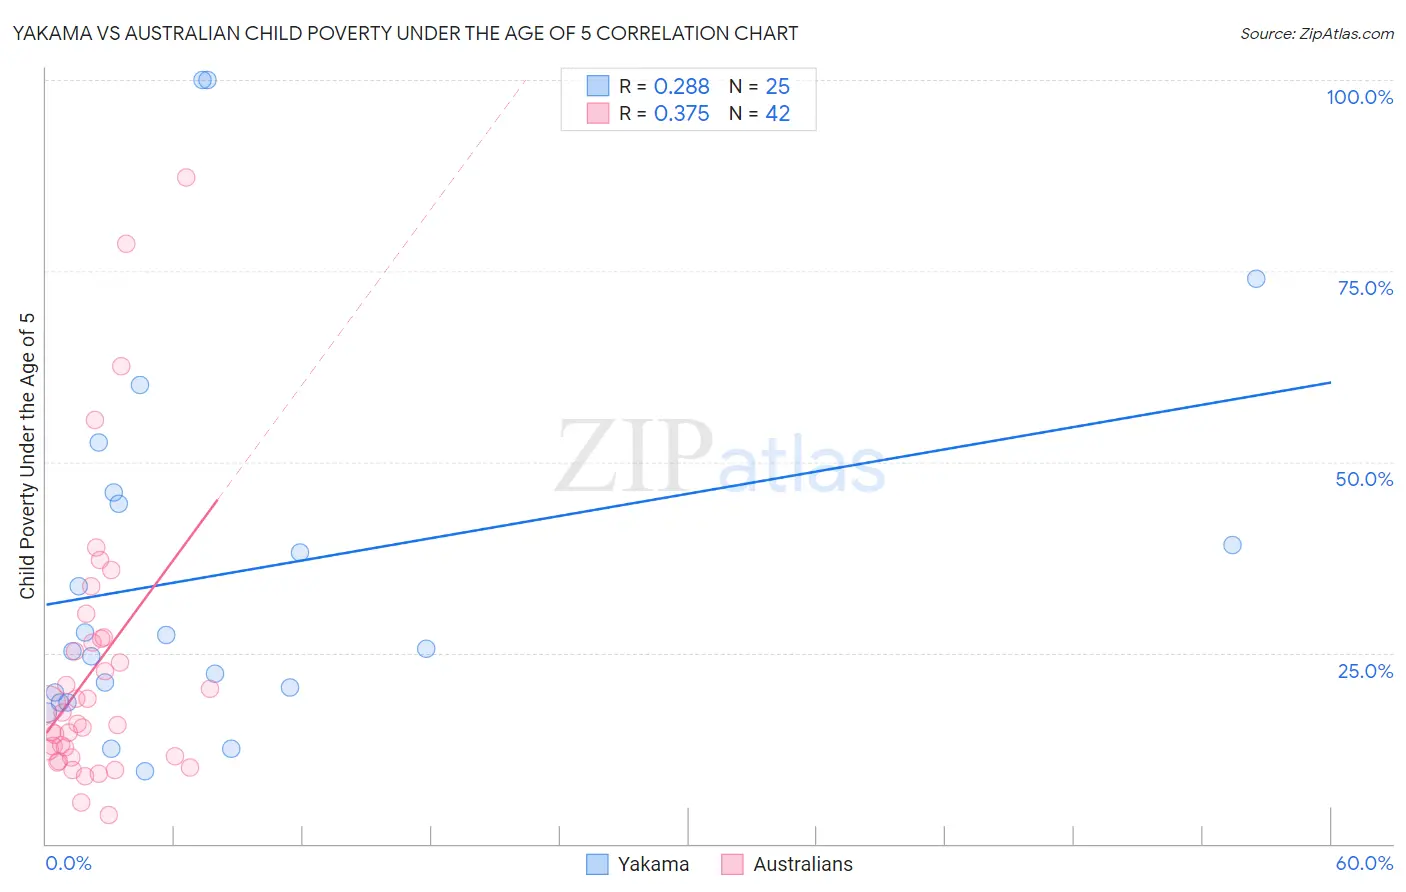
Yakama vs Australian Child Poverty Under the Age of 5 Correlation Chart
The statistical analysis conducted on geographies consisting of 19,733,416 people shows a weak positive correlation between the proportion of Yakama and poverty level among children under the age of 5 in the United States with a correlation coefficient (R) of 0.288 and weighted average of 23.1%. Similarly, the statistical analysis conducted on geographies consisting of 216,887,244 people shows a mild positive correlation between the proportion of Australians and poverty level among children under the age of 5 in the United States with a correlation coefficient (R) of 0.375 and weighted average of 15.5%, a difference of 49.4%.
Child Poverty Under the Age of 5 Correlation Summary
| Measurement | Yakama | Australian |
| Minimum | 9.4% | 3.7% |
| Maximum | 100.0% | 87.2% |
| Range | 90.6% | 83.5% |
| Mean | 35.6% | 23.0% |
| Median | 25.6% | 16.5% |
| Interquartile 25% (IQ1) | 19.1% | 11.4% |
| Interquartile 75% (IQ3) | 45.3% | 26.9% |
| Interquartile Range (IQR) | 26.1% | 15.5% |
| Standard Deviation (Sample) | 24.9% | 18.3% |
| Standard Deviation (Population) | 24.4% | 18.1% |
Similar Demographics by Child Poverty Under the Age of 5
Demographics Similar to Yakama by Child Poverty Under the Age of 5
In terms of child poverty under the age of 5, the demographic groups most similar to Yakama are Arapaho (23.1%, a difference of 0.12%), Menominee (23.3%, a difference of 0.50%), Dutch West Indian (23.3%, a difference of 0.60%), U.S. Virgin Islander (23.0%, a difference of 0.68%), and Bahamian (23.0%, a difference of 0.76%).
| Demographics | Rating | Rank | Child Poverty Under the Age of 5 |
| Houma | 0.0 /100 | #309 | Tragic 22.7% |
| Africans | 0.0 /100 | #310 | Tragic 22.8% |
| Seminole | 0.0 /100 | #311 | Tragic 22.8% |
| Hondurans | 0.0 /100 | #312 | Tragic 23.0% |
| Bahamians | 0.0 /100 | #313 | Tragic 23.0% |
| U.S. Virgin Islanders | 0.0 /100 | #314 | Tragic 23.0% |
| Arapaho | 0.0 /100 | #315 | Tragic 23.1% |
| Yakama | 0.0 /100 | #316 | Tragic 23.1% |
| Menominee | 0.0 /100 | #317 | Tragic 23.3% |
| Dutch West Indians | 0.0 /100 | #318 | Tragic 23.3% |
| Chippewa | 0.0 /100 | #319 | Tragic 23.4% |
| Choctaw | 0.0 /100 | #320 | Tragic 23.5% |
| Immigrants | Honduras | 0.0 /100 | #321 | Tragic 23.5% |
| Ute | 0.0 /100 | #322 | Tragic 23.5% |
| Pueblo | 0.0 /100 | #323 | Tragic 23.7% |
Demographics Similar to Australians by Child Poverty Under the Age of 5
In terms of child poverty under the age of 5, the demographic groups most similar to Australians are Italian (15.5%, a difference of 0.11%), Czech (15.5%, a difference of 0.23%), Sri Lankan (15.5%, a difference of 0.25%), Immigrants from Italy (15.6%, a difference of 0.37%), and Chilean (15.6%, a difference of 0.53%).
| Demographics | Rating | Rank | Child Poverty Under the Age of 5 |
| Immigrants | Sweden | 98.8 /100 | #72 | Exceptional 15.3% |
| Immigrants | Ukraine | 98.7 /100 | #73 | Exceptional 15.3% |
| Argentineans | 98.5 /100 | #74 | Exceptional 15.4% |
| Immigrants | Argentina | 98.5 /100 | #75 | Exceptional 15.4% |
| Croatians | 98.5 /100 | #76 | Exceptional 15.4% |
| Immigrants | Turkey | 98.3 /100 | #77 | Exceptional 15.4% |
| Sri Lankans | 98.1 /100 | #78 | Exceptional 15.5% |
| Australians | 98.0 /100 | #79 | Exceptional 15.5% |
| Italians | 97.9 /100 | #80 | Exceptional 15.5% |
| Czechs | 97.8 /100 | #81 | Exceptional 15.5% |
| Immigrants | Italy | 97.7 /100 | #82 | Exceptional 15.6% |
| Chileans | 97.6 /100 | #83 | Exceptional 15.6% |
| Immigrants | Netherlands | 97.6 /100 | #84 | Exceptional 15.6% |
| Immigrants | Latvia | 97.4 /100 | #85 | Exceptional 15.6% |
| Immigrants | Malaysia | 97.4 /100 | #86 | Exceptional 15.6% |