Immigrants from Austria vs Immigrants from Cuba Poverty
COMPARE
Immigrants from Austria
Immigrants from Cuba
Poverty
Poverty Comparison
Immigrants from Austria
Immigrants from Cuba
11.1%
POVERTY
98.6/ 100
METRIC RATING
53rd/ 347
METRIC RANK
14.6%
POVERTY
0.1/ 100
METRIC RATING
269th/ 347
METRIC RANK
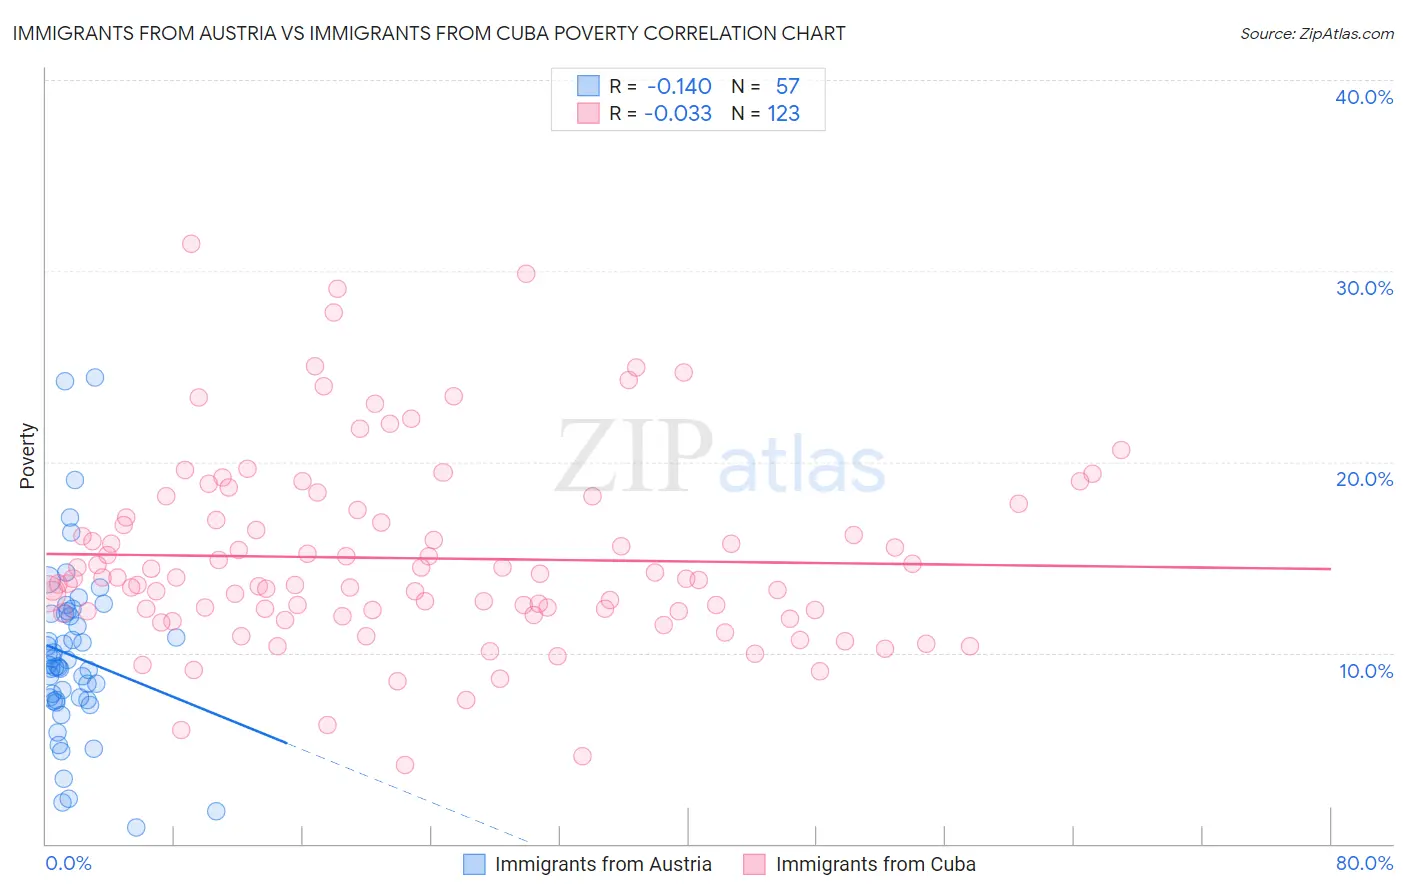
Immigrants from Austria vs Immigrants from Cuba Poverty Correlation Chart
The statistical analysis conducted on geographies consisting of 167,938,578 people shows a poor negative correlation between the proportion of Immigrants from Austria and poverty level in the United States with a correlation coefficient (R) of -0.140 and weighted average of 11.1%. Similarly, the statistical analysis conducted on geographies consisting of 325,967,480 people shows no correlation between the proportion of Immigrants from Cuba and poverty level in the United States with a correlation coefficient (R) of -0.033 and weighted average of 14.6%, a difference of 31.7%.
Poverty Correlation Summary
| Measurement | Immigrants from Austria | Immigrants from Cuba |
| Minimum | 0.88% | 4.1% |
| Maximum | 24.4% | 31.4% |
| Range | 23.6% | 27.3% |
| Mean | 9.8% | 15.0% |
| Median | 9.3% | 13.9% |
| Interquartile 25% (IQ1) | 7.5% | 12.2% |
| Interquartile 75% (IQ3) | 12.1% | 17.1% |
| Interquartile Range (IQR) | 4.5% | 4.9% |
| Standard Deviation (Sample) | 4.5% | 5.0% |
| Standard Deviation (Population) | 4.5% | 5.0% |
Similar Demographics by Poverty
Demographics Similar to Immigrants from Austria by Poverty
In terms of poverty, the demographic groups most similar to Immigrants from Austria are Immigrants from Bulgaria (11.1%, a difference of 0.12%), Immigrants from Serbia (11.1%, a difference of 0.15%), Immigrants from Philippines (11.0%, a difference of 0.23%), Immigrants from Croatia (11.0%, a difference of 0.24%), and Estonian (11.1%, a difference of 0.63%).
| Demographics | Rating | Rank | Poverty |
| Immigrants | Czechoslovakia | 98.9 /100 | #46 | Exceptional 11.0% |
| Immigrants | Romania | 98.9 /100 | #47 | Exceptional 11.0% |
| Slovenes | 98.9 /100 | #48 | Exceptional 11.0% |
| Immigrants | Japan | 98.9 /100 | #49 | Exceptional 11.0% |
| Asians | 98.9 /100 | #50 | Exceptional 11.0% |
| Immigrants | Croatia | 98.7 /100 | #51 | Exceptional 11.0% |
| Immigrants | Philippines | 98.7 /100 | #52 | Exceptional 11.0% |
| Immigrants | Austria | 98.6 /100 | #53 | Exceptional 11.1% |
| Immigrants | Bulgaria | 98.5 /100 | #54 | Exceptional 11.1% |
| Immigrants | Serbia | 98.5 /100 | #55 | Exceptional 11.1% |
| Estonians | 98.2 /100 | #56 | Exceptional 11.1% |
| Scandinavians | 98.2 /100 | #57 | Exceptional 11.1% |
| Germans | 98.1 /100 | #58 | Exceptional 11.1% |
| Immigrants | Europe | 98.0 /100 | #59 | Exceptional 11.2% |
| Immigrants | Sri Lanka | 97.9 /100 | #60 | Exceptional 11.2% |
Demographics Similar to Immigrants from Cuba by Poverty
In terms of poverty, the demographic groups most similar to Immigrants from Cuba are Central American (14.6%, a difference of 0.14%), Subsaharan African (14.5%, a difference of 0.15%), Iroquois (14.5%, a difference of 0.19%), Guyanese (14.5%, a difference of 0.51%), and Immigrants from Guyana (14.5%, a difference of 0.68%).
| Demographics | Rating | Rank | Poverty |
| Immigrants | Liberia | 0.1 /100 | #262 | Tragic 14.4% |
| Jamaicans | 0.1 /100 | #263 | Tragic 14.4% |
| Immigrants | Jamaica | 0.1 /100 | #264 | Tragic 14.4% |
| Immigrants | Guyana | 0.1 /100 | #265 | Tragic 14.5% |
| Guyanese | 0.1 /100 | #266 | Tragic 14.5% |
| Iroquois | 0.1 /100 | #267 | Tragic 14.5% |
| Sub-Saharan Africans | 0.1 /100 | #268 | Tragic 14.5% |
| Immigrants | Cuba | 0.1 /100 | #269 | Tragic 14.6% |
| Central Americans | 0.1 /100 | #270 | Tragic 14.6% |
| Shoshone | 0.0 /100 | #271 | Tragic 14.7% |
| Chickasaw | 0.0 /100 | #272 | Tragic 14.7% |
| Spanish Americans | 0.0 /100 | #273 | Tragic 14.7% |
| Barbadians | 0.0 /100 | #274 | Tragic 14.8% |
| Immigrants | West Indies | 0.0 /100 | #275 | Tragic 14.8% |
| Immigrants | Bahamas | 0.0 /100 | #276 | Tragic 14.8% |