Immigrants from Austria vs Colville Family Poverty
COMPARE
Immigrants from Austria
Colville
Family Poverty
Family Poverty Comparison
Immigrants from Austria
Colville
7.6%
FAMILY POVERTY
99.1/ 100
METRIC RATING
43rd/ 347
METRIC RANK
13.0%
FAMILY POVERTY
0.0/ 100
METRIC RATING
326th/ 347
METRIC RANK
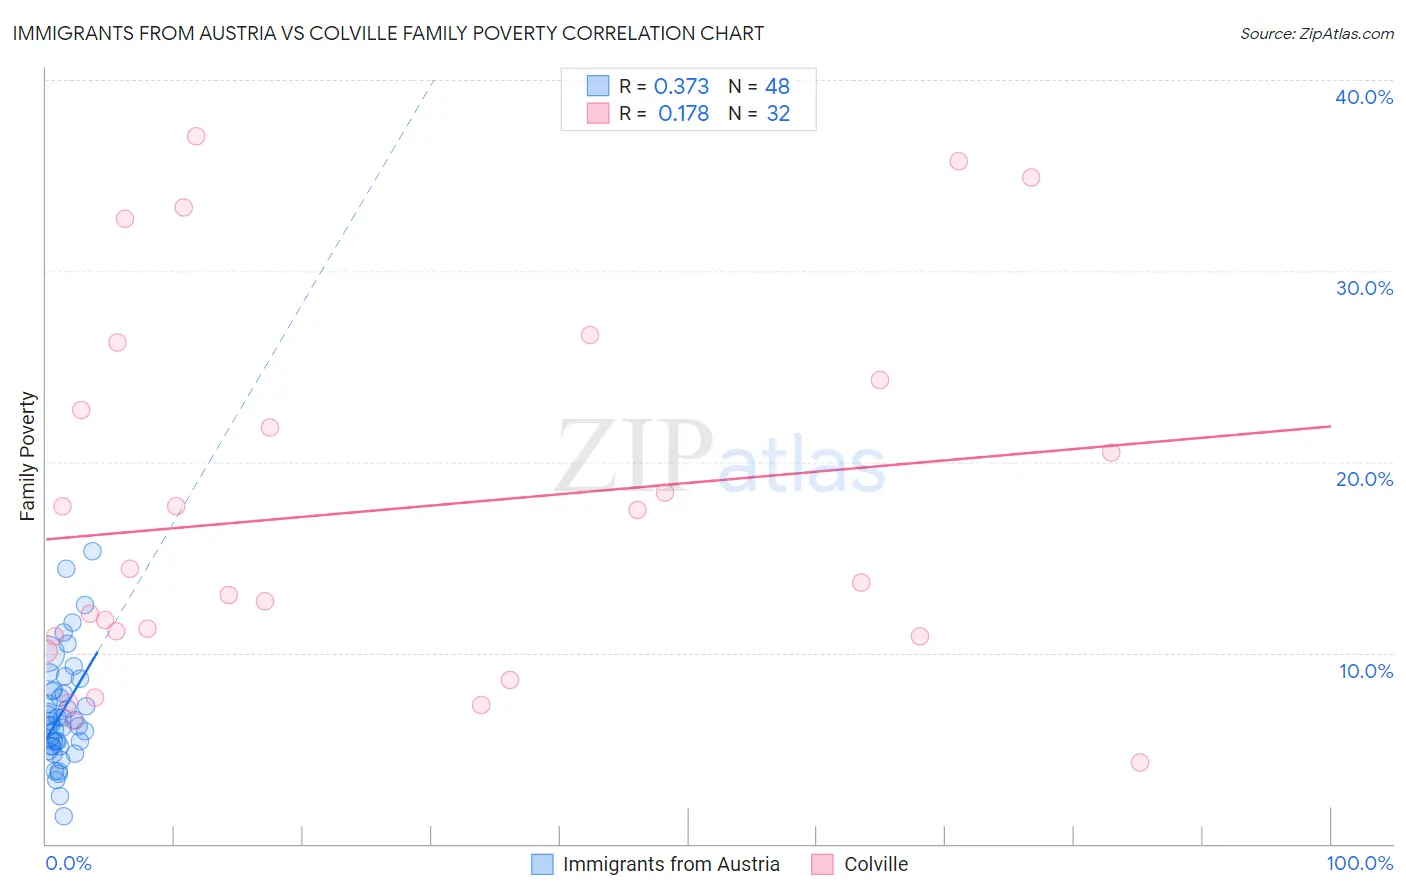
Immigrants from Austria vs Colville Family Poverty Correlation Chart
The statistical analysis conducted on geographies consisting of 167,754,432 people shows a mild positive correlation between the proportion of Immigrants from Austria and poverty level among families in the United States with a correlation coefficient (R) of 0.373 and weighted average of 7.6%. Similarly, the statistical analysis conducted on geographies consisting of 34,676,230 people shows a poor positive correlation between the proportion of Colville and poverty level among families in the United States with a correlation coefficient (R) of 0.178 and weighted average of 13.0%, a difference of 70.3%.
Family Poverty Correlation Summary
| Measurement | Immigrants from Austria | Colville |
| Minimum | 1.4% | 4.3% |
| Maximum | 15.3% | 37.1% |
| Range | 13.9% | 32.8% |
| Mean | 6.9% | 17.5% |
| Median | 6.3% | 14.0% |
| Interquartile 25% (IQ1) | 5.1% | 10.9% |
| Interquartile 75% (IQ3) | 8.0% | 23.5% |
| Interquartile Range (IQR) | 2.9% | 12.6% |
| Standard Deviation (Sample) | 2.8% | 9.5% |
| Standard Deviation (Population) | 2.8% | 9.3% |
Similar Demographics by Family Poverty
Demographics Similar to Immigrants from Austria by Family Poverty
In terms of family poverty, the demographic groups most similar to Immigrants from Austria are Scandinavian (7.6%, a difference of 0.24%), German (7.7%, a difference of 0.29%), Okinawan (7.7%, a difference of 0.41%), Tongan (7.7%, a difference of 0.43%), and Immigrants from Czechoslovakia (7.7%, a difference of 0.44%).
| Demographics | Rating | Rank | Family Poverty |
| Turks | 99.4 /100 | #36 | Exceptional 7.5% |
| Estonians | 99.4 /100 | #37 | Exceptional 7.5% |
| Bolivians | 99.3 /100 | #38 | Exceptional 7.5% |
| Carpatho Rusyns | 99.3 /100 | #39 | Exceptional 7.5% |
| Slovenes | 99.3 /100 | #40 | Exceptional 7.5% |
| Immigrants | Australia | 99.2 /100 | #41 | Exceptional 7.6% |
| Scandinavians | 99.1 /100 | #42 | Exceptional 7.6% |
| Immigrants | Austria | 99.1 /100 | #43 | Exceptional 7.6% |
| Germans | 99.0 /100 | #44 | Exceptional 7.7% |
| Okinawans | 98.9 /100 | #45 | Exceptional 7.7% |
| Tongans | 98.9 /100 | #46 | Exceptional 7.7% |
| Immigrants | Czechoslovakia | 98.9 /100 | #47 | Exceptional 7.7% |
| Immigrants | Sri Lanka | 98.9 /100 | #48 | Exceptional 7.7% |
| Immigrants | Bolivia | 98.9 /100 | #49 | Exceptional 7.7% |
| Immigrants | North Macedonia | 98.9 /100 | #50 | Exceptional 7.7% |
Demographics Similar to Colville by Family Poverty
In terms of family poverty, the demographic groups most similar to Colville are Paiute (13.0%, a difference of 0.060%), Yakama (13.1%, a difference of 0.68%), Immigrants from Dominica (12.7%, a difference of 2.0%), Menominee (12.7%, a difference of 2.1%), and Central American Indian (13.3%, a difference of 2.4%).
| Demographics | Rating | Rank | Family Poverty |
| British West Indians | 0.0 /100 | #319 | Tragic 12.4% |
| Inupiat | 0.0 /100 | #320 | Tragic 12.5% |
| Arapaho | 0.0 /100 | #321 | Tragic 12.7% |
| Immigrants | Honduras | 0.0 /100 | #322 | Tragic 12.7% |
| Menominee | 0.0 /100 | #323 | Tragic 12.7% |
| Immigrants | Dominica | 0.0 /100 | #324 | Tragic 12.7% |
| Paiute | 0.0 /100 | #325 | Tragic 13.0% |
| Colville | 0.0 /100 | #326 | Tragic 13.0% |
| Yakama | 0.0 /100 | #327 | Tragic 13.1% |
| Central American Indians | 0.0 /100 | #328 | Tragic 13.3% |
| Blacks/African Americans | 0.0 /100 | #329 | Tragic 13.3% |
| Natives/Alaskans | 0.0 /100 | #330 | Tragic 14.3% |
| Cheyenne | 0.0 /100 | #331 | Tragic 14.3% |
| Dominicans | 0.0 /100 | #332 | Tragic 14.3% |
| Immigrants | Dominican Republic | 0.0 /100 | #333 | Tragic 14.4% |