Immigrants from Australia vs Immigrants Child Poverty Under the Age of 16
COMPARE
Immigrants from Australia
Immigrants
Child Poverty Under the Age of 16
Child Poverty Under the Age of 16 Comparison
Immigrants from Australia
Immigrants
13.6%
CHILD POVERTY UNDER THE AGE OF 16
99.5/ 100
METRIC RATING
39th/ 347
METRIC RANK
17.5%
CHILD POVERTY UNDER THE AGE OF 16
6.5/ 100
METRIC RATING
212th/ 347
METRIC RANK
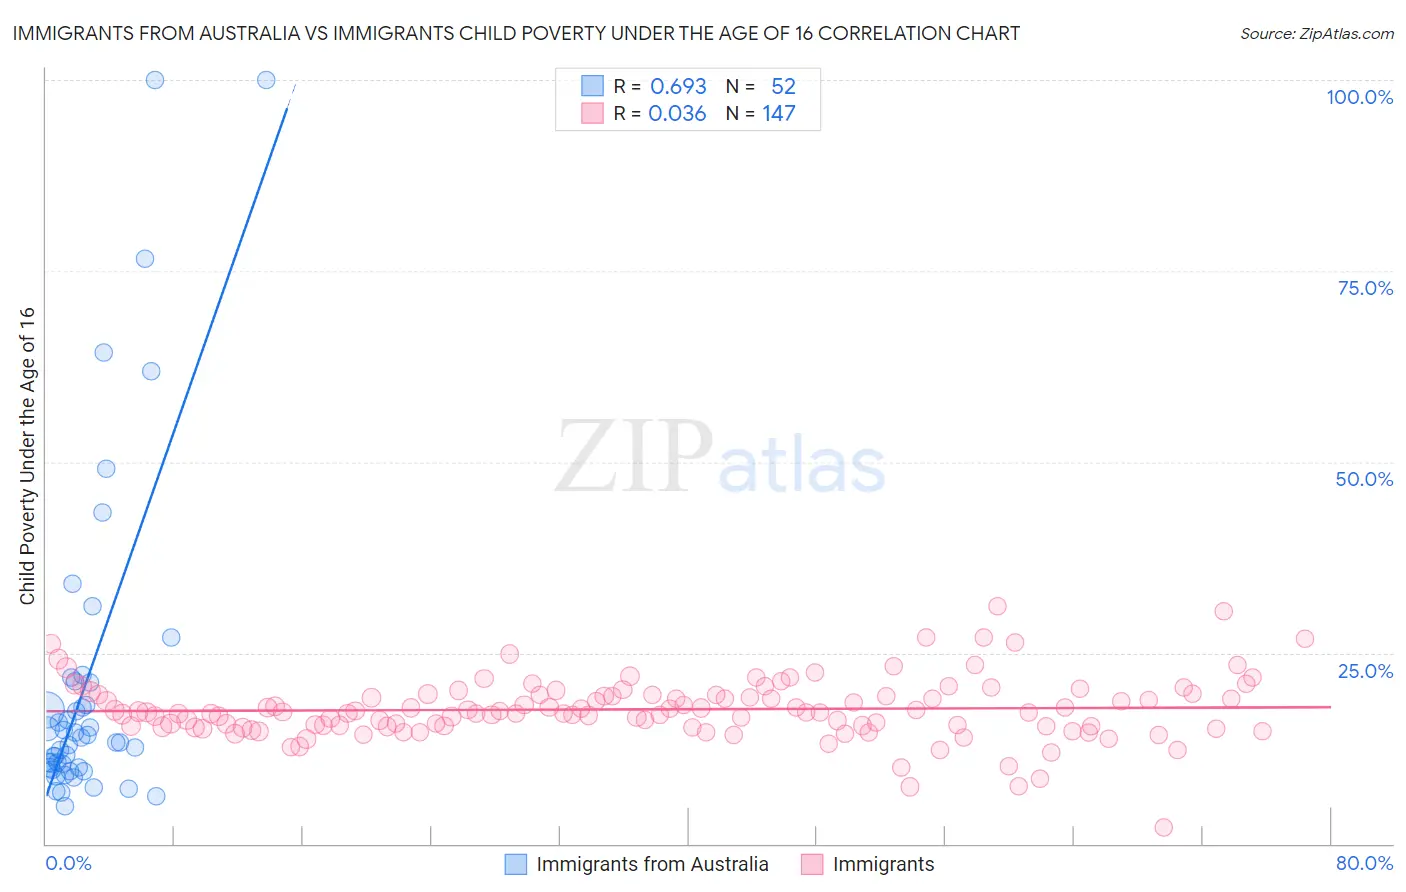
Immigrants from Australia vs Immigrants Child Poverty Under the Age of 16 Correlation Chart
The statistical analysis conducted on geographies consisting of 225,602,461 people shows a significant positive correlation between the proportion of Immigrants from Australia and poverty level among children under the age of 16 in the United States with a correlation coefficient (R) of 0.693 and weighted average of 13.6%. Similarly, the statistical analysis conducted on geographies consisting of 564,478,832 people shows no correlation between the proportion of Immigrants and poverty level among children under the age of 16 in the United States with a correlation coefficient (R) of 0.036 and weighted average of 17.5%, a difference of 28.3%.
Child Poverty Under the Age of 16 Correlation Summary
| Measurement | Immigrants from Australia | Immigrants |
| Minimum | 4.9% | 2.1% |
| Maximum | 100.0% | 31.1% |
| Range | 95.1% | 29.0% |
| Mean | 21.5% | 17.6% |
| Median | 13.6% | 17.2% |
| Interquartile 25% (IQ1) | 10.0% | 15.4% |
| Interquartile 75% (IQ3) | 21.2% | 19.6% |
| Interquartile Range (IQR) | 11.2% | 4.2% |
| Standard Deviation (Sample) | 21.9% | 4.0% |
| Standard Deviation (Population) | 21.7% | 4.0% |
Similar Demographics by Child Poverty Under the Age of 16
Demographics Similar to Immigrants from Australia by Child Poverty Under the Age of 16
In terms of child poverty under the age of 16, the demographic groups most similar to Immigrants from Australia are Luxembourger (13.6%, a difference of 0.020%), Immigrants from Bolivia (13.6%, a difference of 0.54%), Immigrants from Northern Europe (13.6%, a difference of 0.55%), Immigrants from Scotland (13.7%, a difference of 0.69%), and Lithuanian (13.5%, a difference of 0.79%).
| Demographics | Rating | Rank | Child Poverty Under the Age of 16 |
| Tongans | 99.7 /100 | #32 | Exceptional 13.4% |
| Asians | 99.6 /100 | #33 | Exceptional 13.5% |
| Russians | 99.6 /100 | #34 | Exceptional 13.5% |
| Lithuanians | 99.6 /100 | #35 | Exceptional 13.5% |
| Immigrants | Northern Europe | 99.6 /100 | #36 | Exceptional 13.6% |
| Immigrants | Bolivia | 99.6 /100 | #37 | Exceptional 13.6% |
| Luxembourgers | 99.5 /100 | #38 | Exceptional 13.6% |
| Immigrants | Australia | 99.5 /100 | #39 | Exceptional 13.6% |
| Immigrants | Scotland | 99.4 /100 | #40 | Exceptional 13.7% |
| Croatians | 99.4 /100 | #41 | Exceptional 13.8% |
| Immigrants | Sri Lanka | 99.3 /100 | #42 | Exceptional 13.8% |
| Immigrants | Moldova | 99.3 /100 | #43 | Exceptional 13.8% |
| Greeks | 99.3 /100 | #44 | Exceptional 13.8% |
| Czechs | 99.3 /100 | #45 | Exceptional 13.8% |
| Immigrants | Asia | 99.2 /100 | #46 | Exceptional 13.8% |
Demographics Similar to Immigrants by Child Poverty Under the Age of 16
In terms of child poverty under the age of 16, the demographic groups most similar to Immigrants are Immigrants from Thailand (17.5%, a difference of 0.020%), Alaskan Athabascan (17.5%, a difference of 0.15%), Panamanian (17.5%, a difference of 0.16%), Immigrants from the Azores (17.5%, a difference of 0.17%), and Iraqi (17.5%, a difference of 0.29%).
| Demographics | Rating | Rank | Child Poverty Under the Age of 16 |
| Aleuts | 13.9 /100 | #205 | Poor 17.1% |
| Alaska Natives | 11.8 /100 | #206 | Poor 17.2% |
| German Russians | 8.6 /100 | #207 | Tragic 17.4% |
| Pennsylvania Germans | 7.5 /100 | #208 | Tragic 17.4% |
| Panamanians | 6.9 /100 | #209 | Tragic 17.5% |
| Alaskan Athabascans | 6.9 /100 | #210 | Tragic 17.5% |
| Immigrants | Thailand | 6.6 /100 | #211 | Tragic 17.5% |
| Immigrants | Immigrants | 6.5 /100 | #212 | Tragic 17.5% |
| Immigrants | Azores | 6.2 /100 | #213 | Tragic 17.5% |
| Iraqis | 5.9 /100 | #214 | Tragic 17.5% |
| Malaysians | 5.9 /100 | #215 | Tragic 17.5% |
| Sierra Leoneans | 5.7 /100 | #216 | Tragic 17.6% |
| Immigrants | Eastern Africa | 5.3 /100 | #217 | Tragic 17.6% |
| Moroccans | 5.3 /100 | #218 | Tragic 17.6% |
| Japanese | 4.7 /100 | #219 | Tragic 17.7% |