Immigrants from Hungary vs Immigrants Child Poverty Under the Age of 16
COMPARE
Immigrants from Hungary
Immigrants
Child Poverty Under the Age of 16
Child Poverty Under the Age of 16 Comparison
Immigrants from Hungary
Immigrants
15.5%
CHILD POVERTY UNDER THE AGE OF 16
81.9/ 100
METRIC RATING
144th/ 347
METRIC RANK
17.5%
CHILD POVERTY UNDER THE AGE OF 16
6.5/ 100
METRIC RATING
212th/ 347
METRIC RANK
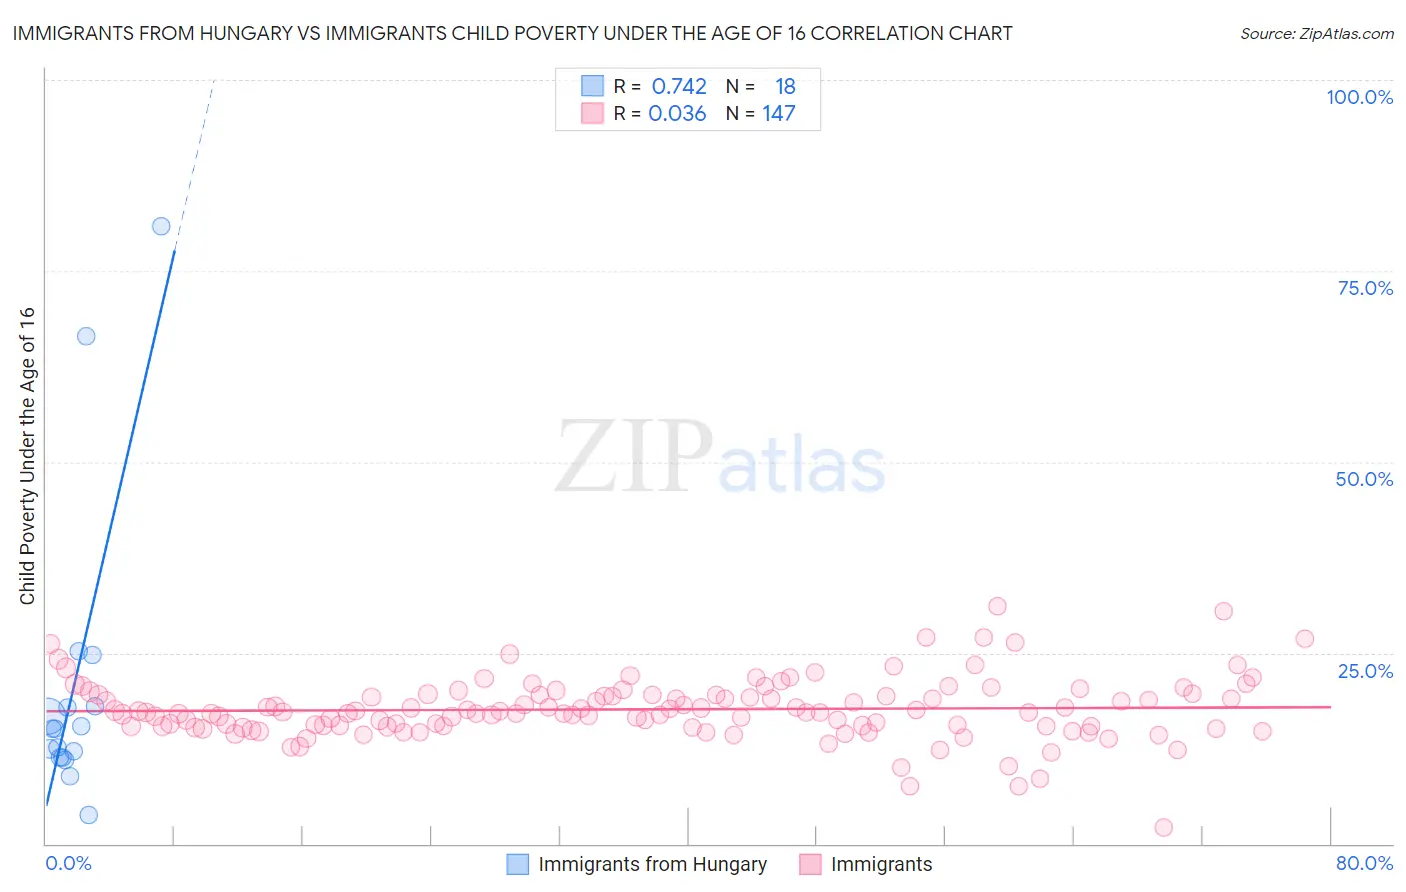
Immigrants from Hungary vs Immigrants Child Poverty Under the Age of 16 Correlation Chart
The statistical analysis conducted on geographies consisting of 194,708,253 people shows a strong positive correlation between the proportion of Immigrants from Hungary and poverty level among children under the age of 16 in the United States with a correlation coefficient (R) of 0.742 and weighted average of 15.5%. Similarly, the statistical analysis conducted on geographies consisting of 564,478,832 people shows no correlation between the proportion of Immigrants and poverty level among children under the age of 16 in the United States with a correlation coefficient (R) of 0.036 and weighted average of 17.5%, a difference of 13.1%.
Child Poverty Under the Age of 16 Correlation Summary
| Measurement | Immigrants from Hungary | Immigrants |
| Minimum | 3.7% | 2.1% |
| Maximum | 80.8% | 31.1% |
| Range | 77.1% | 29.0% |
| Mean | 21.0% | 17.6% |
| Median | 15.0% | 17.2% |
| Interquartile 25% (IQ1) | 11.4% | 15.4% |
| Interquartile 75% (IQ3) | 17.9% | 19.6% |
| Interquartile Range (IQR) | 6.6% | 4.2% |
| Standard Deviation (Sample) | 20.0% | 4.0% |
| Standard Deviation (Population) | 19.4% | 4.0% |
Similar Demographics by Child Poverty Under the Age of 16
Demographics Similar to Immigrants from Hungary by Child Poverty Under the Age of 16
In terms of child poverty under the age of 16, the demographic groups most similar to Immigrants from Hungary are Immigrants from Peru (15.5%, a difference of 0.050%), Slovak (15.5%, a difference of 0.10%), Icelander (15.4%, a difference of 0.12%), Brazilian (15.4%, a difference of 0.19%), and Immigrants from Kuwait (15.5%, a difference of 0.29%).
| Demographics | Rating | Rank | Child Poverty Under the Age of 16 |
| Peruvians | 87.2 /100 | #137 | Excellent 15.3% |
| Welsh | 87.2 /100 | #138 | Excellent 15.3% |
| Immigrants | Vietnam | 87.1 /100 | #139 | Excellent 15.3% |
| New Zealanders | 86.9 /100 | #140 | Excellent 15.3% |
| Slavs | 84.2 /100 | #141 | Excellent 15.4% |
| Brazilians | 82.8 /100 | #142 | Excellent 15.4% |
| Icelanders | 82.5 /100 | #143 | Excellent 15.4% |
| Immigrants | Hungary | 81.9 /100 | #144 | Excellent 15.5% |
| Immigrants | Peru | 81.7 /100 | #145 | Excellent 15.5% |
| Slovaks | 81.4 /100 | #146 | Excellent 15.5% |
| Immigrants | Kuwait | 80.5 /100 | #147 | Excellent 15.5% |
| Puget Sound Salish | 80.3 /100 | #148 | Excellent 15.5% |
| Israelis | 80.1 /100 | #149 | Excellent 15.5% |
| Immigrants | Jordan | 78.5 /100 | #150 | Good 15.6% |
| French | 78.5 /100 | #151 | Good 15.6% |
Demographics Similar to Immigrants by Child Poverty Under the Age of 16
In terms of child poverty under the age of 16, the demographic groups most similar to Immigrants are Immigrants from Thailand (17.5%, a difference of 0.020%), Alaskan Athabascan (17.5%, a difference of 0.15%), Panamanian (17.5%, a difference of 0.16%), Immigrants from the Azores (17.5%, a difference of 0.17%), and Iraqi (17.5%, a difference of 0.29%).
| Demographics | Rating | Rank | Child Poverty Under the Age of 16 |
| Aleuts | 13.9 /100 | #205 | Poor 17.1% |
| Alaska Natives | 11.8 /100 | #206 | Poor 17.2% |
| German Russians | 8.6 /100 | #207 | Tragic 17.4% |
| Pennsylvania Germans | 7.5 /100 | #208 | Tragic 17.4% |
| Panamanians | 6.9 /100 | #209 | Tragic 17.5% |
| Alaskan Athabascans | 6.9 /100 | #210 | Tragic 17.5% |
| Immigrants | Thailand | 6.6 /100 | #211 | Tragic 17.5% |
| Immigrants | Immigrants | 6.5 /100 | #212 | Tragic 17.5% |
| Immigrants | Azores | 6.2 /100 | #213 | Tragic 17.5% |
| Iraqis | 5.9 /100 | #214 | Tragic 17.5% |
| Malaysians | 5.9 /100 | #215 | Tragic 17.5% |
| Sierra Leoneans | 5.7 /100 | #216 | Tragic 17.6% |
| Immigrants | Eastern Africa | 5.3 /100 | #217 | Tragic 17.6% |
| Moroccans | 5.3 /100 | #218 | Tragic 17.6% |
| Japanese | 4.7 /100 | #219 | Tragic 17.7% |