Immigrants from Australia vs Indonesian Child Poverty Under the Age of 16
COMPARE
Immigrants from Australia
Indonesian
Child Poverty Under the Age of 16
Child Poverty Under the Age of 16 Comparison
Immigrants from Australia
Indonesians
13.6%
CHILD POVERTY UNDER THE AGE OF 16
99.5/ 100
METRIC RATING
39th/ 347
METRIC RANK
21.0%
CHILD POVERTY UNDER THE AGE OF 16
0.0/ 100
METRIC RATING
300th/ 347
METRIC RANK
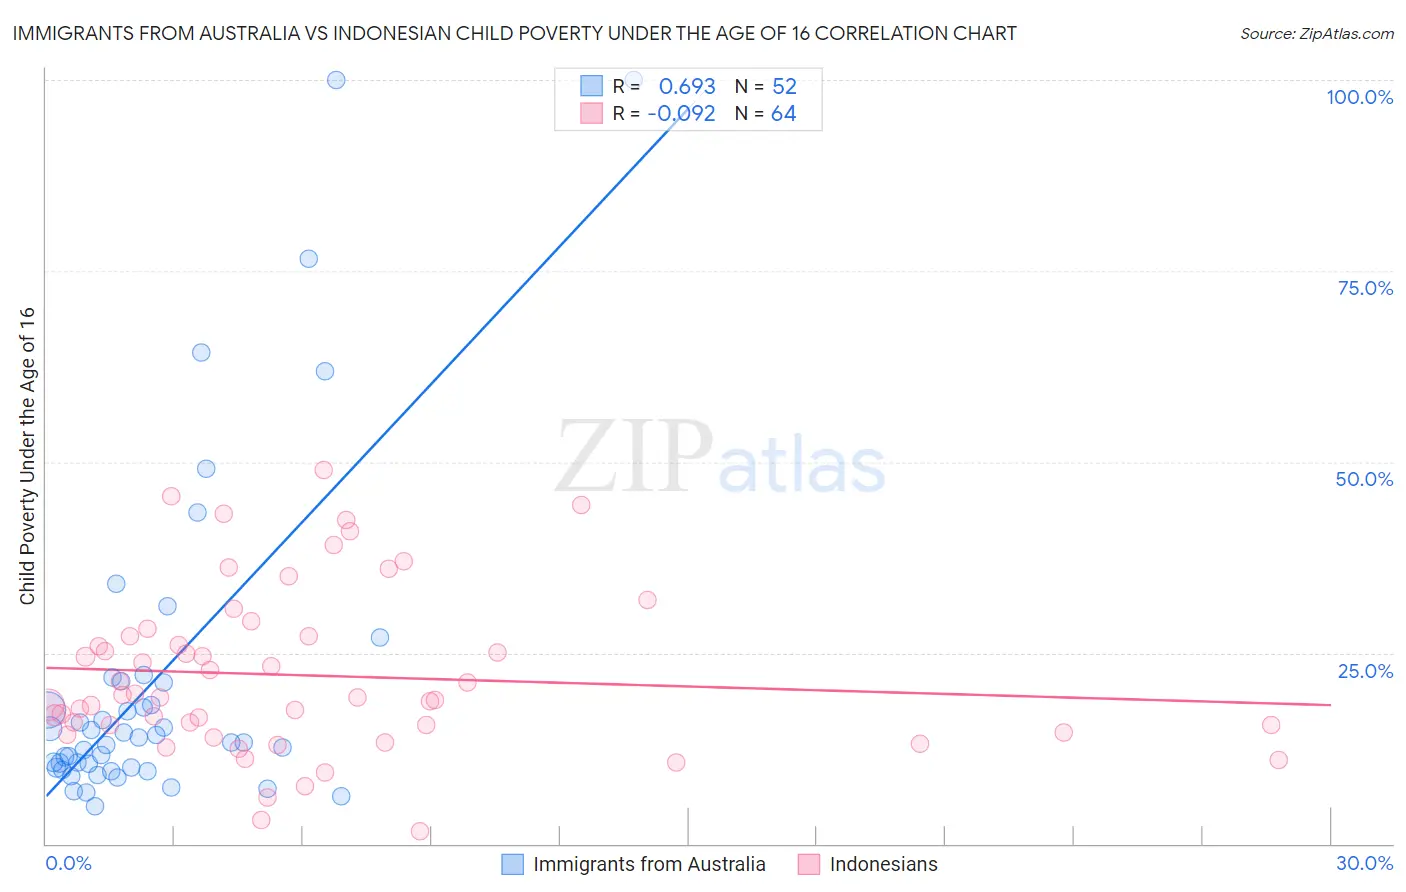
Immigrants from Australia vs Indonesian Child Poverty Under the Age of 16 Correlation Chart
The statistical analysis conducted on geographies consisting of 225,602,461 people shows a significant positive correlation between the proportion of Immigrants from Australia and poverty level among children under the age of 16 in the United States with a correlation coefficient (R) of 0.693 and weighted average of 13.6%. Similarly, the statistical analysis conducted on geographies consisting of 162,203,177 people shows a slight negative correlation between the proportion of Indonesians and poverty level among children under the age of 16 in the United States with a correlation coefficient (R) of -0.092 and weighted average of 21.0%, a difference of 53.7%.
Child Poverty Under the Age of 16 Correlation Summary
| Measurement | Immigrants from Australia | Indonesian |
| Minimum | 4.9% | 1.7% |
| Maximum | 100.0% | 48.9% |
| Range | 95.1% | 47.2% |
| Mean | 21.5% | 22.0% |
| Median | 13.6% | 19.1% |
| Interquartile 25% (IQ1) | 10.0% | 15.0% |
| Interquartile 75% (IQ3) | 21.2% | 27.1% |
| Interquartile Range (IQR) | 11.2% | 12.1% |
| Standard Deviation (Sample) | 21.9% | 10.7% |
| Standard Deviation (Population) | 21.7% | 10.7% |
Similar Demographics by Child Poverty Under the Age of 16
Demographics Similar to Immigrants from Australia by Child Poverty Under the Age of 16
In terms of child poverty under the age of 16, the demographic groups most similar to Immigrants from Australia are Luxembourger (13.6%, a difference of 0.020%), Immigrants from Bolivia (13.6%, a difference of 0.54%), Immigrants from Northern Europe (13.6%, a difference of 0.55%), Immigrants from Scotland (13.7%, a difference of 0.69%), and Lithuanian (13.5%, a difference of 0.79%).
| Demographics | Rating | Rank | Child Poverty Under the Age of 16 |
| Tongans | 99.7 /100 | #32 | Exceptional 13.4% |
| Asians | 99.6 /100 | #33 | Exceptional 13.5% |
| Russians | 99.6 /100 | #34 | Exceptional 13.5% |
| Lithuanians | 99.6 /100 | #35 | Exceptional 13.5% |
| Immigrants | Northern Europe | 99.6 /100 | #36 | Exceptional 13.6% |
| Immigrants | Bolivia | 99.6 /100 | #37 | Exceptional 13.6% |
| Luxembourgers | 99.5 /100 | #38 | Exceptional 13.6% |
| Immigrants | Australia | 99.5 /100 | #39 | Exceptional 13.6% |
| Immigrants | Scotland | 99.4 /100 | #40 | Exceptional 13.7% |
| Croatians | 99.4 /100 | #41 | Exceptional 13.8% |
| Immigrants | Sri Lanka | 99.3 /100 | #42 | Exceptional 13.8% |
| Immigrants | Moldova | 99.3 /100 | #43 | Exceptional 13.8% |
| Greeks | 99.3 /100 | #44 | Exceptional 13.8% |
| Czechs | 99.3 /100 | #45 | Exceptional 13.8% |
| Immigrants | Asia | 99.2 /100 | #46 | Exceptional 13.8% |
Demographics Similar to Indonesians by Child Poverty Under the Age of 16
In terms of child poverty under the age of 16, the demographic groups most similar to Indonesians are Immigrants from Grenada (21.0%, a difference of 0.040%), Immigrants from Bahamas (21.0%, a difference of 0.28%), Choctaw (21.0%, a difference of 0.32%), Somali (21.0%, a difference of 0.37%), and Immigrants from Haiti (20.9%, a difference of 0.49%).
| Demographics | Rating | Rank | Child Poverty Under the Age of 16 |
| Immigrants | Senegal | 0.0 /100 | #293 | Tragic 20.6% |
| Haitians | 0.0 /100 | #294 | Tragic 20.7% |
| Mexicans | 0.0 /100 | #295 | Tragic 20.7% |
| Immigrants | Caribbean | 0.0 /100 | #296 | Tragic 20.8% |
| Hispanics or Latinos | 0.0 /100 | #297 | Tragic 20.8% |
| Arapaho | 0.0 /100 | #298 | Tragic 20.8% |
| Immigrants | Haiti | 0.0 /100 | #299 | Tragic 20.9% |
| Indonesians | 0.0 /100 | #300 | Tragic 21.0% |
| Immigrants | Grenada | 0.0 /100 | #301 | Tragic 21.0% |
| Immigrants | Bahamas | 0.0 /100 | #302 | Tragic 21.0% |
| Choctaw | 0.0 /100 | #303 | Tragic 21.0% |
| Somalis | 0.0 /100 | #304 | Tragic 21.0% |
| Seminole | 0.0 /100 | #305 | Tragic 21.1% |
| Guatemalans | 0.0 /100 | #306 | Tragic 21.2% |
| Immigrants | Central America | 0.0 /100 | #307 | Tragic 21.3% |