Immigrants from Australia vs Immigrants Unemployment Among Seniors over 65 years
COMPARE
Immigrants from Australia
Immigrants
Unemployment Among Seniors over 65 years
Unemployment Among Seniors over 65 years Comparison
Immigrants from Australia
Immigrants
5.1%
UNEMPLOYMENT AMONG SENIORS OVER 65 YEARS
85.8/ 100
METRIC RATING
131st/ 347
METRIC RANK
5.4%
UNEMPLOYMENT AMONG SENIORS OVER 65 YEARS
0.6/ 100
METRIC RATING
249th/ 347
METRIC RANK
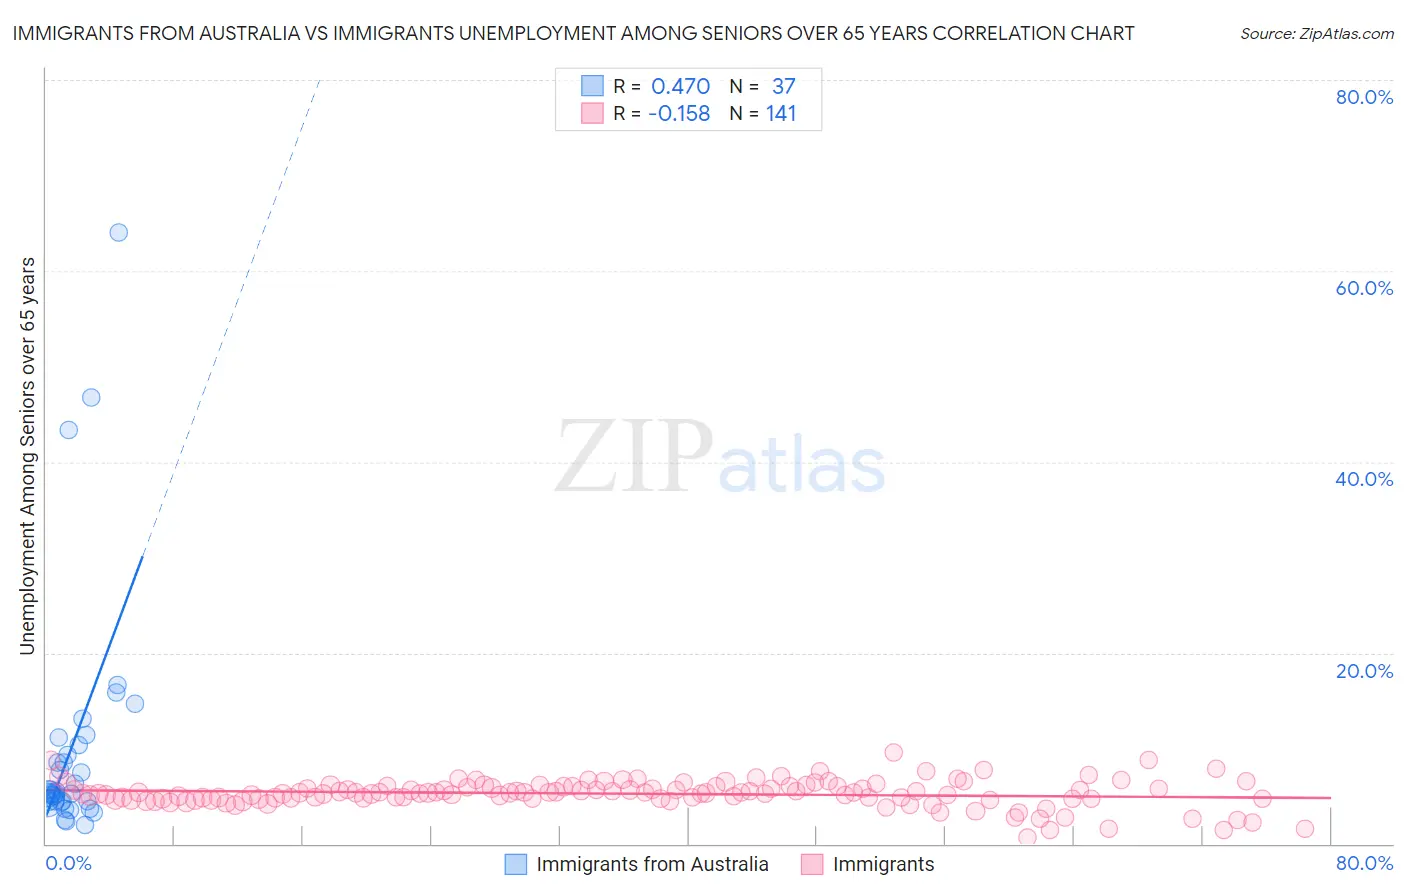
Immigrants from Australia vs Immigrants Unemployment Among Seniors over 65 years Correlation Chart
The statistical analysis conducted on geographies consisting of 213,507,453 people shows a moderate positive correlation between the proportion of Immigrants from Australia and unemployment rate amomg seniors over the age of 65 in the United States with a correlation coefficient (R) of 0.470 and weighted average of 5.1%. Similarly, the statistical analysis conducted on geographies consisting of 464,359,515 people shows a poor negative correlation between the proportion of Immigrants and unemployment rate amomg seniors over the age of 65 in the United States with a correlation coefficient (R) of -0.158 and weighted average of 5.4%, a difference of 5.6%.
Unemployment Among Seniors over 65 years Correlation Summary
| Measurement | Immigrants from Australia | Immigrants |
| Minimum | 1.9% | 0.60% |
| Maximum | 64.0% | 9.5% |
| Range | 62.1% | 8.9% |
| Mean | 10.4% | 5.3% |
| Median | 5.3% | 5.3% |
| Interquartile 25% (IQ1) | 4.5% | 4.7% |
| Interquartile 75% (IQ3) | 10.8% | 6.0% |
| Interquartile Range (IQR) | 6.3% | 1.3% |
| Standard Deviation (Sample) | 13.1% | 1.4% |
| Standard Deviation (Population) | 13.0% | 1.4% |
Similar Demographics by Unemployment Among Seniors over 65 years
Demographics Similar to Immigrants from Australia by Unemployment Among Seniors over 65 years
In terms of unemployment among seniors over 65 years, the demographic groups most similar to Immigrants from Australia are Chilean (5.1%, a difference of 0.010%), Syrian (5.1%, a difference of 0.030%), Immigrants from England (5.1%, a difference of 0.060%), Iranian (5.1%, a difference of 0.060%), and Turkish (5.1%, a difference of 0.060%).
| Demographics | Rating | Rank | Unemployment Among Seniors over 65 years |
| Immigrants | North America | 87.9 /100 | #124 | Excellent 5.1% |
| Dutch | 87.6 /100 | #125 | Excellent 5.1% |
| Immigrants | Sri Lanka | 87.4 /100 | #126 | Excellent 5.1% |
| Sri Lankans | 87.4 /100 | #127 | Excellent 5.1% |
| Australians | 87.1 /100 | #128 | Excellent 5.1% |
| Immigrants | England | 86.7 /100 | #129 | Excellent 5.1% |
| Iranians | 86.6 /100 | #130 | Excellent 5.1% |
| Immigrants | Australia | 85.8 /100 | #131 | Excellent 5.1% |
| Chileans | 85.6 /100 | #132 | Excellent 5.1% |
| Syrians | 85.3 /100 | #133 | Excellent 5.1% |
| Turks | 84.9 /100 | #134 | Excellent 5.1% |
| Ukrainians | 84.4 /100 | #135 | Excellent 5.1% |
| Whites/Caucasians | 84.4 /100 | #136 | Excellent 5.1% |
| Arabs | 84.3 /100 | #137 | Excellent 5.1% |
| New Zealanders | 83.2 /100 | #138 | Excellent 5.1% |
Demographics Similar to Immigrants by Unemployment Among Seniors over 65 years
In terms of unemployment among seniors over 65 years, the demographic groups most similar to Immigrants are Ghanaian (5.4%, a difference of 0.0%), West Indian (5.4%, a difference of 0.010%), French Canadian (5.4%, a difference of 0.020%), Immigrants from Caribbean (5.3%, a difference of 0.080%), and Trinidadian and Tobagonian (5.4%, a difference of 0.080%).
| Demographics | Rating | Rank | Unemployment Among Seniors over 65 years |
| Bahamians | 0.9 /100 | #242 | Tragic 5.3% |
| Nigerians | 0.9 /100 | #243 | Tragic 5.3% |
| Peruvians | 0.8 /100 | #244 | Tragic 5.3% |
| Ottawa | 0.8 /100 | #245 | Tragic 5.3% |
| Colombians | 0.7 /100 | #246 | Tragic 5.3% |
| Immigrants | Caribbean | 0.7 /100 | #247 | Tragic 5.3% |
| French Canadians | 0.7 /100 | #248 | Tragic 5.4% |
| Immigrants | Immigrants | 0.6 /100 | #249 | Tragic 5.4% |
| Ghanaians | 0.6 /100 | #250 | Tragic 5.4% |
| West Indians | 0.6 /100 | #251 | Tragic 5.4% |
| Trinidadians and Tobagonians | 0.6 /100 | #252 | Tragic 5.4% |
| Immigrants | Sierra Leone | 0.6 /100 | #253 | Tragic 5.4% |
| Paraguayans | 0.5 /100 | #254 | Tragic 5.4% |
| Immigrants | Peru | 0.5 /100 | #255 | Tragic 5.4% |
| Moroccans | 0.5 /100 | #256 | Tragic 5.4% |