Immigrants from Australia vs Immigrants from Eastern Africa Child Poverty Under the Age of 16
COMPARE
Immigrants from Australia
Immigrants from Eastern Africa
Child Poverty Under the Age of 16
Child Poverty Under the Age of 16 Comparison
Immigrants from Australia
Immigrants from Eastern Africa
13.6%
CHILD POVERTY UNDER THE AGE OF 16
99.5/ 100
METRIC RATING
39th/ 347
METRIC RANK
17.6%
CHILD POVERTY UNDER THE AGE OF 16
5.3/ 100
METRIC RATING
217th/ 347
METRIC RANK
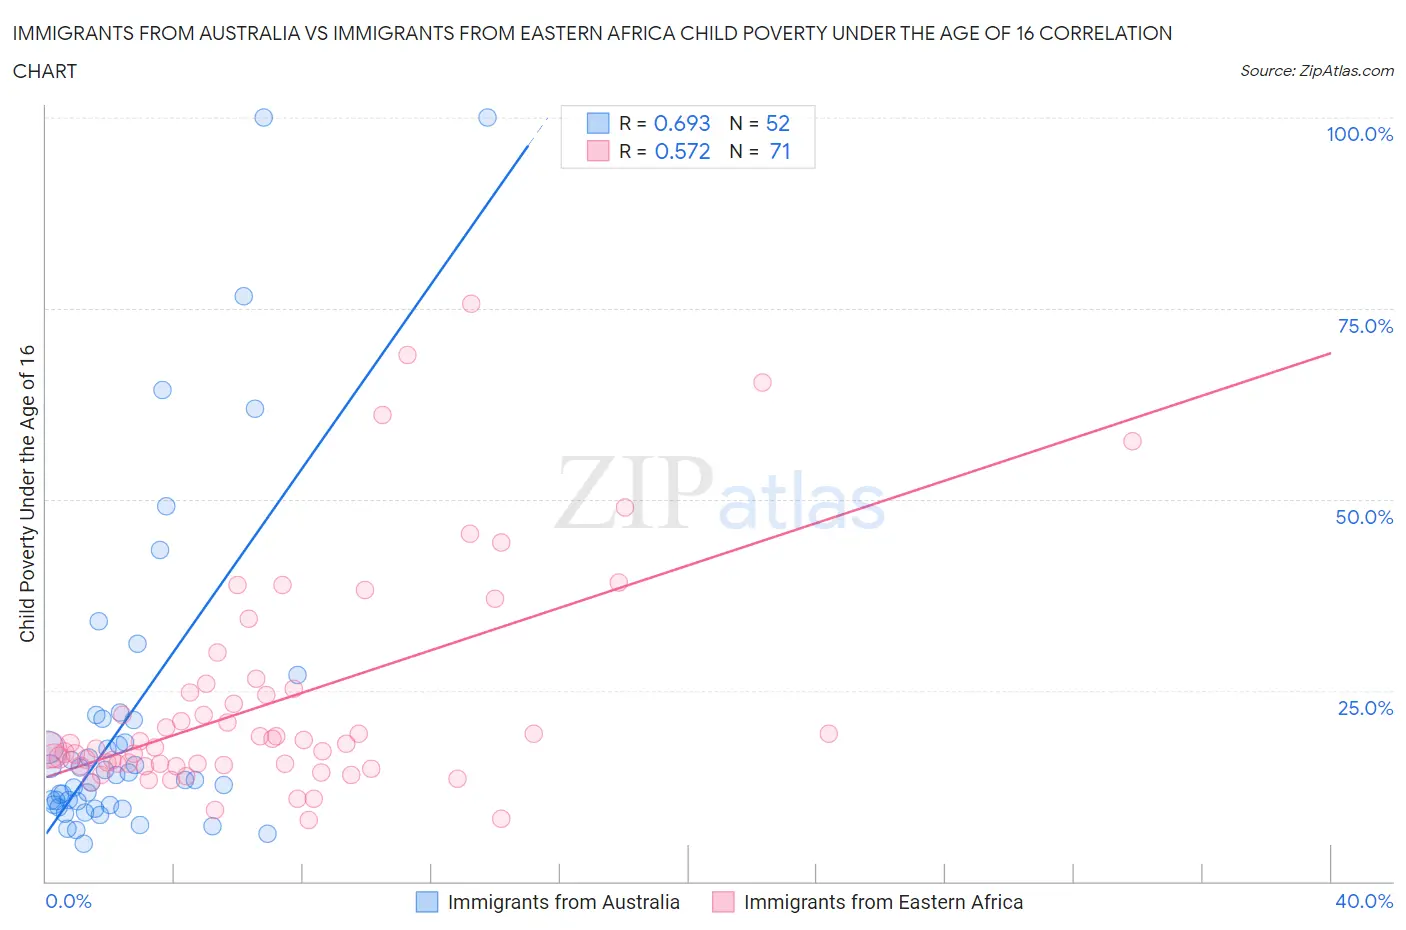
Immigrants from Australia vs Immigrants from Eastern Africa Child Poverty Under the Age of 16 Correlation Chart
The statistical analysis conducted on geographies consisting of 225,602,461 people shows a significant positive correlation between the proportion of Immigrants from Australia and poverty level among children under the age of 16 in the United States with a correlation coefficient (R) of 0.693 and weighted average of 13.6%. Similarly, the statistical analysis conducted on geographies consisting of 352,909,115 people shows a substantial positive correlation between the proportion of Immigrants from Eastern Africa and poverty level among children under the age of 16 in the United States with a correlation coefficient (R) of 0.572 and weighted average of 17.6%, a difference of 29.1%.
Child Poverty Under the Age of 16 Correlation Summary
| Measurement | Immigrants from Australia | Immigrants from Eastern Africa |
| Minimum | 4.9% | 8.0% |
| Maximum | 100.0% | 75.6% |
| Range | 95.1% | 67.6% |
| Mean | 21.5% | 23.6% |
| Median | 13.6% | 17.9% |
| Interquartile 25% (IQ1) | 10.0% | 15.3% |
| Interquartile 75% (IQ3) | 21.2% | 25.2% |
| Interquartile Range (IQR) | 11.2% | 9.9% |
| Standard Deviation (Sample) | 21.9% | 14.8% |
| Standard Deviation (Population) | 21.7% | 14.7% |
Similar Demographics by Child Poverty Under the Age of 16
Demographics Similar to Immigrants from Australia by Child Poverty Under the Age of 16
In terms of child poverty under the age of 16, the demographic groups most similar to Immigrants from Australia are Luxembourger (13.6%, a difference of 0.020%), Immigrants from Bolivia (13.6%, a difference of 0.54%), Immigrants from Northern Europe (13.6%, a difference of 0.55%), Immigrants from Scotland (13.7%, a difference of 0.69%), and Lithuanian (13.5%, a difference of 0.79%).
| Demographics | Rating | Rank | Child Poverty Under the Age of 16 |
| Tongans | 99.7 /100 | #32 | Exceptional 13.4% |
| Asians | 99.6 /100 | #33 | Exceptional 13.5% |
| Russians | 99.6 /100 | #34 | Exceptional 13.5% |
| Lithuanians | 99.6 /100 | #35 | Exceptional 13.5% |
| Immigrants | Northern Europe | 99.6 /100 | #36 | Exceptional 13.6% |
| Immigrants | Bolivia | 99.6 /100 | #37 | Exceptional 13.6% |
| Luxembourgers | 99.5 /100 | #38 | Exceptional 13.6% |
| Immigrants | Australia | 99.5 /100 | #39 | Exceptional 13.6% |
| Immigrants | Scotland | 99.4 /100 | #40 | Exceptional 13.7% |
| Croatians | 99.4 /100 | #41 | Exceptional 13.8% |
| Immigrants | Sri Lanka | 99.3 /100 | #42 | Exceptional 13.8% |
| Immigrants | Moldova | 99.3 /100 | #43 | Exceptional 13.8% |
| Greeks | 99.3 /100 | #44 | Exceptional 13.8% |
| Czechs | 99.3 /100 | #45 | Exceptional 13.8% |
| Immigrants | Asia | 99.2 /100 | #46 | Exceptional 13.8% |
Demographics Similar to Immigrants from Eastern Africa by Child Poverty Under the Age of 16
In terms of child poverty under the age of 16, the demographic groups most similar to Immigrants from Eastern Africa are Moroccan (17.6%, a difference of 0.010%), Sierra Leonean (17.6%, a difference of 0.18%), Malaysian (17.5%, a difference of 0.30%), Iraqi (17.5%, a difference of 0.32%), and Japanese (17.7%, a difference of 0.37%).
| Demographics | Rating | Rank | Child Poverty Under the Age of 16 |
| Alaskan Athabascans | 6.9 /100 | #210 | Tragic 17.5% |
| Immigrants | Thailand | 6.6 /100 | #211 | Tragic 17.5% |
| Immigrants | Immigrants | 6.5 /100 | #212 | Tragic 17.5% |
| Immigrants | Azores | 6.2 /100 | #213 | Tragic 17.5% |
| Iraqis | 5.9 /100 | #214 | Tragic 17.5% |
| Malaysians | 5.9 /100 | #215 | Tragic 17.5% |
| Sierra Leoneans | 5.7 /100 | #216 | Tragic 17.6% |
| Immigrants | Eastern Africa | 5.3 /100 | #217 | Tragic 17.6% |
| Moroccans | 5.3 /100 | #218 | Tragic 17.6% |
| Japanese | 4.7 /100 | #219 | Tragic 17.7% |
| Immigrants | Panama | 4.1 /100 | #220 | Tragic 17.7% |
| Cubans | 3.7 /100 | #221 | Tragic 17.8% |
| Immigrants | Armenia | 3.6 /100 | #222 | Tragic 17.8% |
| Immigrants | Cambodia | 3.3 /100 | #223 | Tragic 17.8% |
| Osage | 3.1 /100 | #224 | Tragic 17.9% |