Immigrants from Argentina vs South American Indian Single Male Poverty
COMPARE
Immigrants from Argentina
South American Indian
Single Male Poverty
Single Male Poverty Comparison
Immigrants from Argentina
South American Indians
11.9%
SINGLE MALE POVERTY
99.5/ 100
METRIC RATING
72nd/ 347
METRIC RANK
12.1%
SINGLE MALE POVERTY
98.3/ 100
METRIC RATING
90th/ 347
METRIC RANK
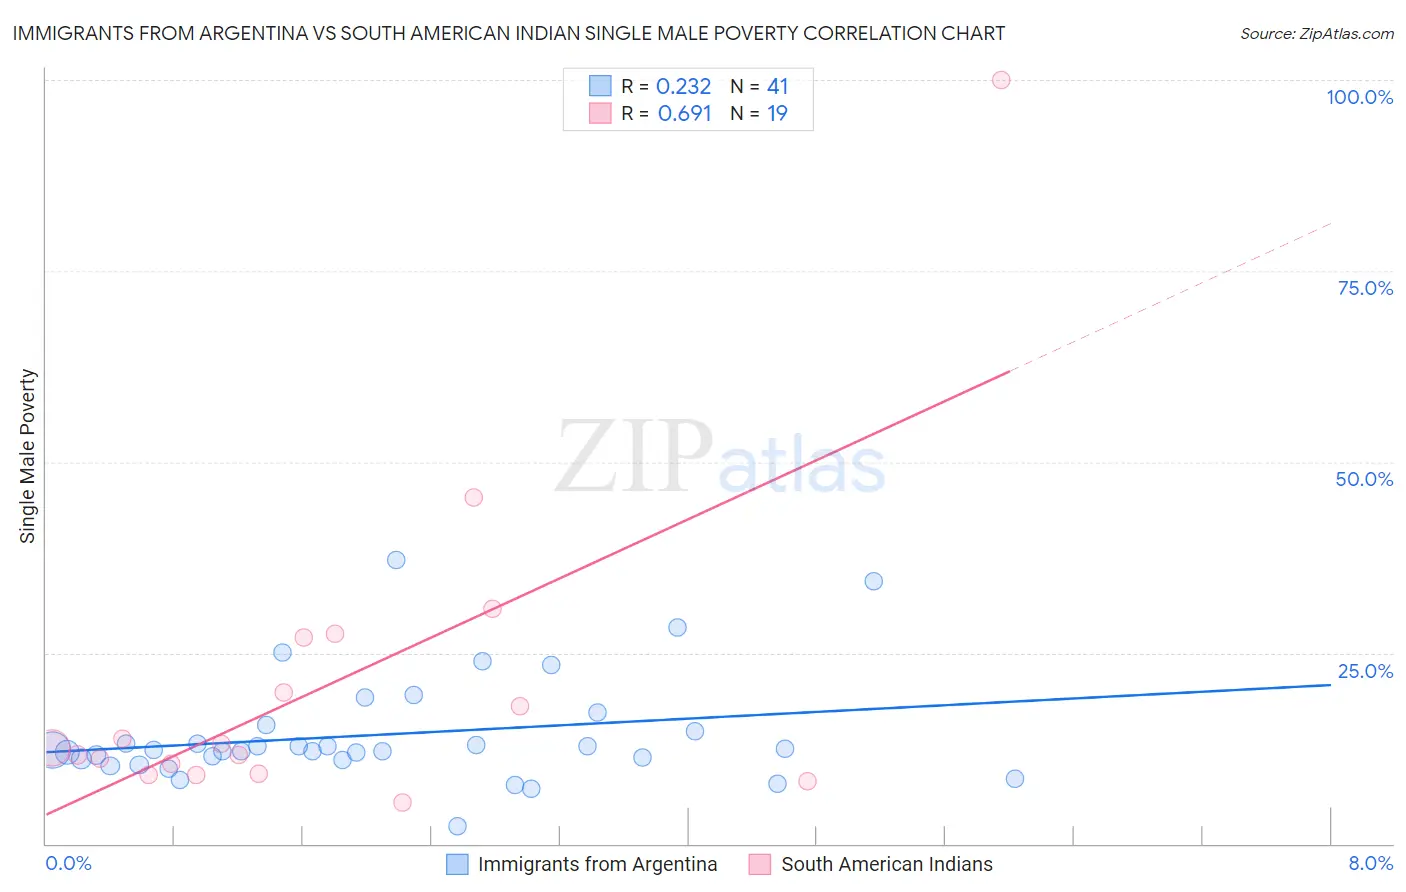
Immigrants from Argentina vs South American Indian Single Male Poverty Correlation Chart
The statistical analysis conducted on geographies consisting of 240,377,704 people shows a weak positive correlation between the proportion of Immigrants from Argentina and poverty level among single males in the United States with a correlation coefficient (R) of 0.232 and weighted average of 11.9%. Similarly, the statistical analysis conducted on geographies consisting of 154,904,356 people shows a significant positive correlation between the proportion of South American Indians and poverty level among single males in the United States with a correlation coefficient (R) of 0.691 and weighted average of 12.1%, a difference of 1.9%.
Single Male Poverty Correlation Summary
| Measurement | Immigrants from Argentina | South American Indian |
| Minimum | 2.3% | 5.4% |
| Maximum | 37.2% | 100.0% |
| Range | 35.0% | 94.6% |
| Mean | 14.3% | 20.7% |
| Median | 12.3% | 12.5% |
| Interquartile 25% (IQ1) | 11.0% | 9.2% |
| Interquartile 75% (IQ3) | 15.2% | 27.0% |
| Interquartile Range (IQR) | 4.1% | 17.8% |
| Standard Deviation (Sample) | 7.0% | 21.6% |
| Standard Deviation (Population) | 7.0% | 21.1% |
Demographics Similar to Immigrants from Argentina and South American Indians by Single Male Poverty
In terms of single male poverty, the demographic groups most similar to Immigrants from Argentina are Argentinean (11.9%, a difference of 0.13%), Immigrants from Greece (11.9%, a difference of 0.18%), Chilean (11.9%, a difference of 0.18%), Uruguayan (11.9%, a difference of 0.37%), and Immigrants from Northern Africa (11.9%, a difference of 0.40%). Similarly, the demographic groups most similar to South American Indians are Immigrants from Ireland (12.1%, a difference of 0.0%), Immigrants from Turkey (12.1%, a difference of 0.050%), South American (12.1%, a difference of 0.18%), Immigrants from Eritrea (12.1%, a difference of 0.18%), and Immigrants from Israel (12.1%, a difference of 0.19%).
| Demographics | Rating | Rank | Single Male Poverty |
| Immigrants | Greece | 99.6 /100 | #71 | Exceptional 11.9% |
| Immigrants | Argentina | 99.5 /100 | #72 | Exceptional 11.9% |
| Argentineans | 99.5 /100 | #73 | Exceptional 11.9% |
| Chileans | 99.5 /100 | #74 | Exceptional 11.9% |
| Uruguayans | 99.4 /100 | #75 | Exceptional 11.9% |
| Immigrants | Northern Africa | 99.4 /100 | #76 | Exceptional 11.9% |
| Immigrants | Malaysia | 99.2 /100 | #77 | Exceptional 12.0% |
| Immigrants | Venezuela | 99.1 /100 | #78 | Exceptional 12.0% |
| Immigrants | Belgium | 99.0 /100 | #79 | Exceptional 12.0% |
| Armenians | 98.7 /100 | #80 | Exceptional 12.1% |
| Immigrants | South America | 98.7 /100 | #81 | Exceptional 12.1% |
| Immigrants | Colombia | 98.6 /100 | #82 | Exceptional 12.1% |
| Immigrants | Chile | 98.6 /100 | #83 | Exceptional 12.1% |
| Immigrants | Czechoslovakia | 98.6 /100 | #84 | Exceptional 12.1% |
| Turks | 98.5 /100 | #85 | Exceptional 12.1% |
| Immigrants | Israel | 98.5 /100 | #86 | Exceptional 12.1% |
| South Americans | 98.5 /100 | #87 | Exceptional 12.1% |
| Immigrants | Eritrea | 98.5 /100 | #88 | Exceptional 12.1% |
| Immigrants | Ireland | 98.3 /100 | #89 | Exceptional 12.1% |
| South American Indians | 98.3 /100 | #90 | Exceptional 12.1% |
| Immigrants | Turkey | 98.2 /100 | #91 | Exceptional 12.1% |