Immigrants from Argentina vs Immigrants from South Eastern Asia Single Male Poverty
COMPARE
Immigrants from Argentina
Immigrants from South Eastern Asia
Single Male Poverty
Single Male Poverty Comparison
Immigrants from Argentina
Immigrants from South Eastern Asia
11.9%
SINGLE MALE POVERTY
99.5/ 100
METRIC RATING
72nd/ 347
METRIC RANK
11.4%
SINGLE MALE POVERTY
100.0/ 100
METRIC RATING
35th/ 347
METRIC RANK
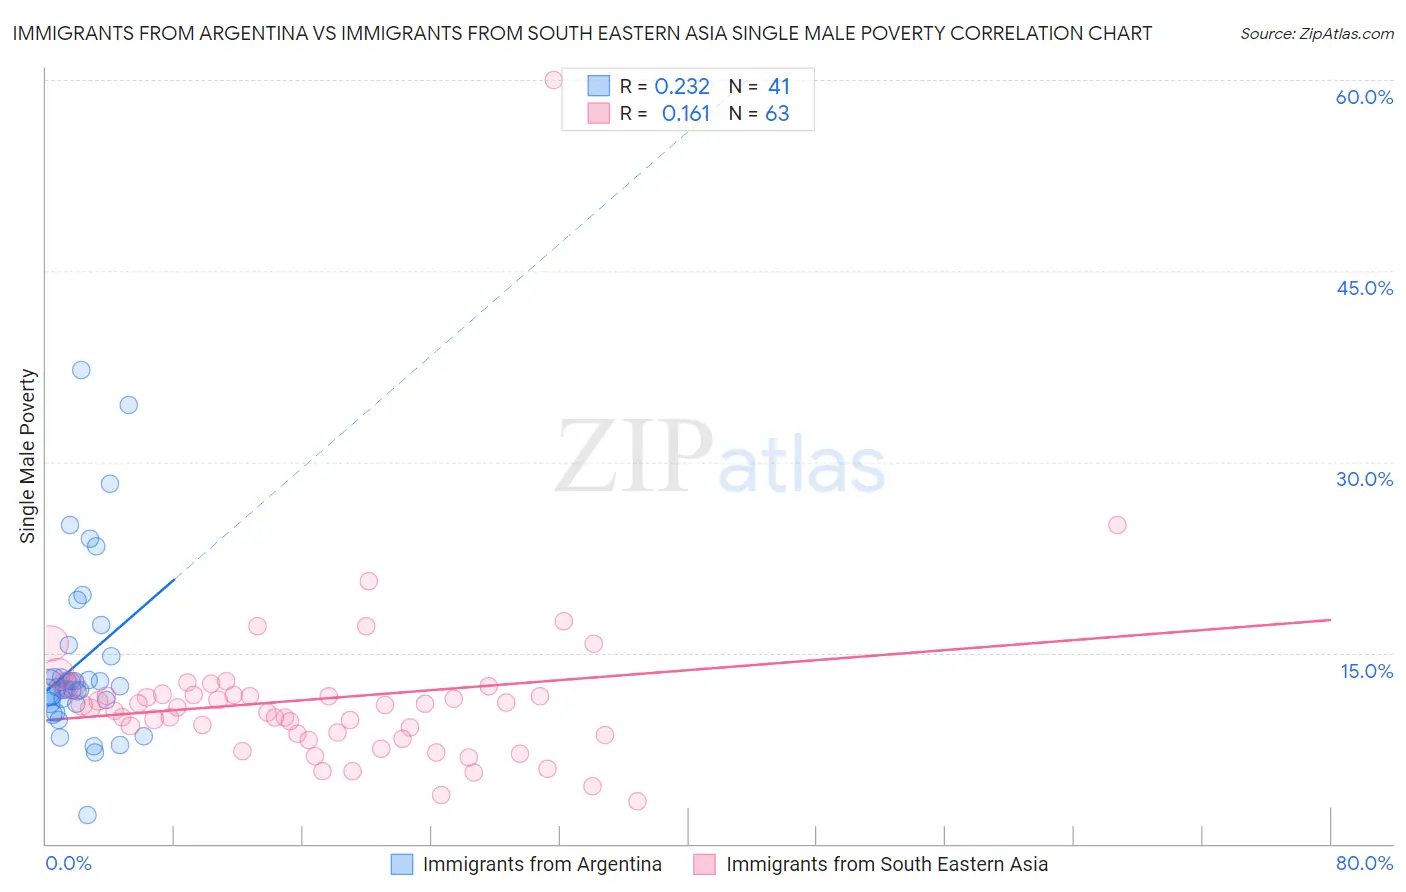
Immigrants from Argentina vs Immigrants from South Eastern Asia Single Male Poverty Correlation Chart
The statistical analysis conducted on geographies consisting of 240,377,704 people shows a weak positive correlation between the proportion of Immigrants from Argentina and poverty level among single males in the United States with a correlation coefficient (R) of 0.232 and weighted average of 11.9%. Similarly, the statistical analysis conducted on geographies consisting of 439,025,043 people shows a poor positive correlation between the proportion of Immigrants from South Eastern Asia and poverty level among single males in the United States with a correlation coefficient (R) of 0.161 and weighted average of 11.4%, a difference of 4.0%.
Single Male Poverty Correlation Summary
| Measurement | Immigrants from Argentina | Immigrants from South Eastern Asia |
| Minimum | 2.3% | 3.3% |
| Maximum | 37.2% | 60.0% |
| Range | 35.0% | 56.7% |
| Mean | 14.3% | 11.4% |
| Median | 12.3% | 10.7% |
| Interquartile 25% (IQ1) | 11.0% | 8.6% |
| Interquartile 75% (IQ3) | 15.2% | 11.7% |
| Interquartile Range (IQR) | 4.1% | 3.2% |
| Standard Deviation (Sample) | 7.0% | 7.3% |
| Standard Deviation (Population) | 7.0% | 7.2% |
Similar Demographics by Single Male Poverty
Demographics Similar to Immigrants from Argentina by Single Male Poverty
In terms of single male poverty, the demographic groups most similar to Immigrants from Argentina are Argentinean (11.9%, a difference of 0.13%), Immigrants from Greece (11.9%, a difference of 0.18%), Chilean (11.9%, a difference of 0.18%), Immigrants from Nepal (11.9%, a difference of 0.24%), and Immigrants from Russia (11.9%, a difference of 0.26%).
| Demographics | Rating | Rank | Single Male Poverty |
| Laotians | 99.6 /100 | #65 | Exceptional 11.9% |
| Immigrants | Uruguay | 99.6 /100 | #66 | Exceptional 11.9% |
| Immigrants | Ukraine | 99.6 /100 | #67 | Exceptional 11.9% |
| Immigrants | Croatia | 99.6 /100 | #68 | Exceptional 11.9% |
| Immigrants | Russia | 99.6 /100 | #69 | Exceptional 11.9% |
| Immigrants | Nepal | 99.6 /100 | #70 | Exceptional 11.9% |
| Immigrants | Greece | 99.6 /100 | #71 | Exceptional 11.9% |
| Immigrants | Argentina | 99.5 /100 | #72 | Exceptional 11.9% |
| Argentineans | 99.5 /100 | #73 | Exceptional 11.9% |
| Chileans | 99.5 /100 | #74 | Exceptional 11.9% |
| Uruguayans | 99.4 /100 | #75 | Exceptional 11.9% |
| Immigrants | Northern Africa | 99.4 /100 | #76 | Exceptional 11.9% |
| Immigrants | Malaysia | 99.2 /100 | #77 | Exceptional 12.0% |
| Immigrants | Venezuela | 99.1 /100 | #78 | Exceptional 12.0% |
| Immigrants | Belgium | 99.0 /100 | #79 | Exceptional 12.0% |
Demographics Similar to Immigrants from South Eastern Asia by Single Male Poverty
In terms of single male poverty, the demographic groups most similar to Immigrants from South Eastern Asia are Immigrants from Serbia (11.4%, a difference of 0.030%), Immigrants from Ethiopia (11.4%, a difference of 0.040%), Immigrants from Vietnam (11.4%, a difference of 0.080%), Immigrants from Singapore (11.4%, a difference of 0.080%), and Immigrants from Eastern Asia (11.4%, a difference of 0.15%).
| Demographics | Rating | Rank | Single Male Poverty |
| Immigrants | Asia | 100.0 /100 | #28 | Exceptional 11.4% |
| Immigrants | Egypt | 100.0 /100 | #29 | Exceptional 11.4% |
| Iranians | 100.0 /100 | #30 | Exceptional 11.4% |
| Immigrants | Iran | 100.0 /100 | #31 | Exceptional 11.4% |
| Immigrants | Eastern Asia | 100.0 /100 | #32 | Exceptional 11.4% |
| Immigrants | Vietnam | 100.0 /100 | #33 | Exceptional 11.4% |
| Immigrants | Ethiopia | 100.0 /100 | #34 | Exceptional 11.4% |
| Immigrants | South Eastern Asia | 100.0 /100 | #35 | Exceptional 11.4% |
| Immigrants | Serbia | 100.0 /100 | #36 | Exceptional 11.4% |
| Immigrants | Singapore | 100.0 /100 | #37 | Exceptional 11.4% |
| Sri Lankans | 100.0 /100 | #38 | Exceptional 11.5% |
| Soviet Union | 100.0 /100 | #39 | Exceptional 11.5% |
| Immigrants | Korea | 100.0 /100 | #40 | Exceptional 11.5% |
| Immigrants | Iraq | 99.9 /100 | #41 | Exceptional 11.5% |
| Egyptians | 99.9 /100 | #42 | Exceptional 11.5% |