Immigrants from Argentina vs Sudanese Single Male Poverty
COMPARE
Immigrants from Argentina
Sudanese
Single Male Poverty
Single Male Poverty Comparison
Immigrants from Argentina
Sudanese
11.9%
SINGLE MALE POVERTY
99.5/ 100
METRIC RATING
72nd/ 347
METRIC RANK
13.1%
SINGLE MALE POVERTY
17.7/ 100
METRIC RATING
207th/ 347
METRIC RANK
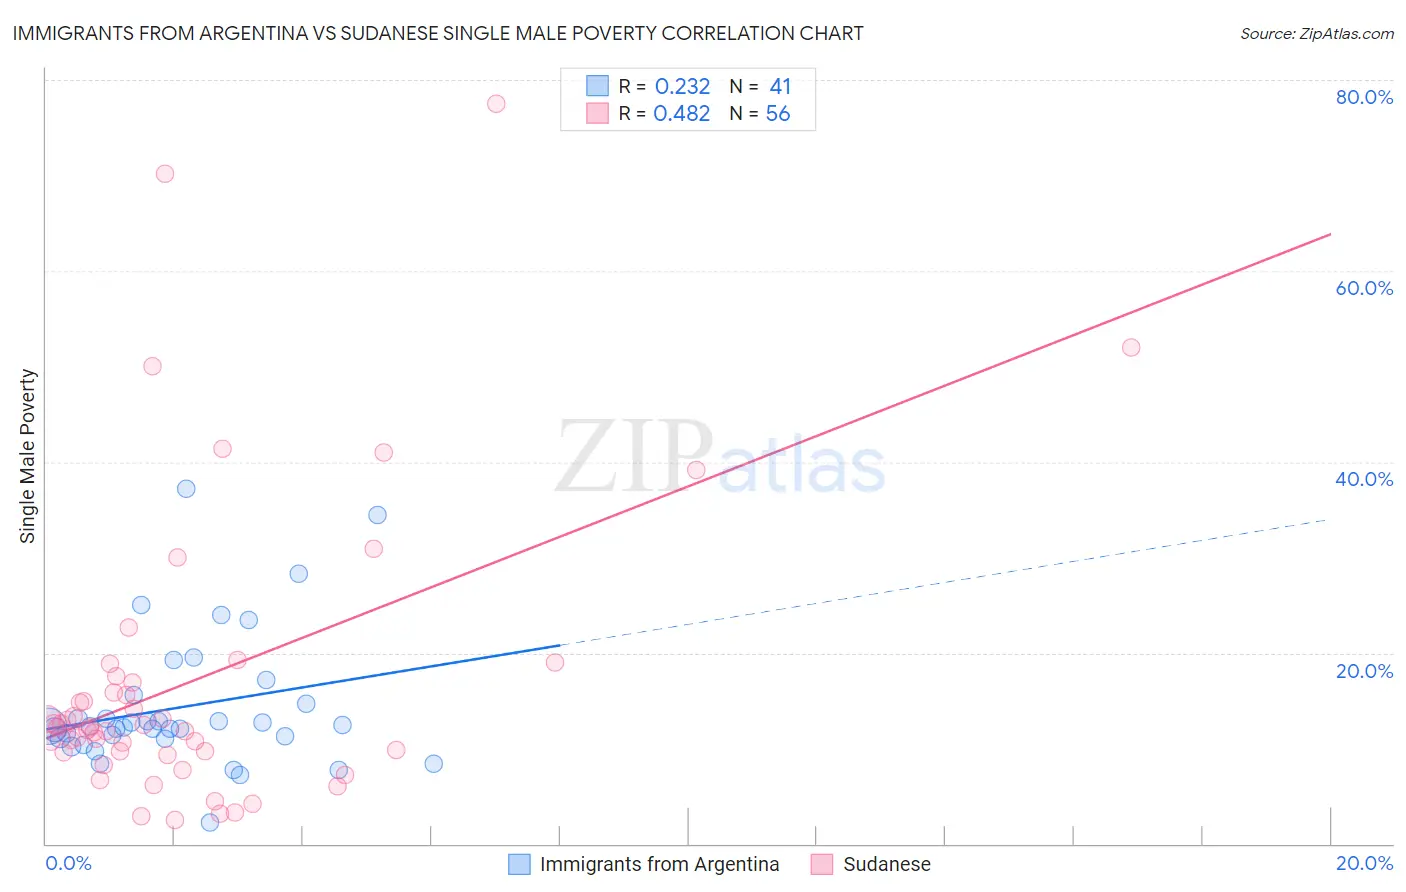
Immigrants from Argentina vs Sudanese Single Male Poverty Correlation Chart
The statistical analysis conducted on geographies consisting of 240,377,704 people shows a weak positive correlation between the proportion of Immigrants from Argentina and poverty level among single males in the United States with a correlation coefficient (R) of 0.232 and weighted average of 11.9%. Similarly, the statistical analysis conducted on geographies consisting of 106,028,362 people shows a moderate positive correlation between the proportion of Sudanese and poverty level among single males in the United States with a correlation coefficient (R) of 0.482 and weighted average of 13.1%, a difference of 9.8%.
Single Male Poverty Correlation Summary
| Measurement | Immigrants from Argentina | Sudanese |
| Minimum | 2.3% | 2.5% |
| Maximum | 37.2% | 77.6% |
| Range | 35.0% | 75.0% |
| Mean | 14.3% | 17.1% |
| Median | 12.3% | 12.2% |
| Interquartile 25% (IQ1) | 11.0% | 9.6% |
| Interquartile 75% (IQ3) | 15.2% | 17.2% |
| Interquartile Range (IQR) | 4.1% | 7.5% |
| Standard Deviation (Sample) | 7.0% | 15.6% |
| Standard Deviation (Population) | 7.0% | 15.5% |
Similar Demographics by Single Male Poverty
Demographics Similar to Immigrants from Argentina by Single Male Poverty
In terms of single male poverty, the demographic groups most similar to Immigrants from Argentina are Argentinean (11.9%, a difference of 0.13%), Immigrants from Greece (11.9%, a difference of 0.18%), Chilean (11.9%, a difference of 0.18%), Immigrants from Nepal (11.9%, a difference of 0.24%), and Immigrants from Russia (11.9%, a difference of 0.26%).
| Demographics | Rating | Rank | Single Male Poverty |
| Laotians | 99.6 /100 | #65 | Exceptional 11.9% |
| Immigrants | Uruguay | 99.6 /100 | #66 | Exceptional 11.9% |
| Immigrants | Ukraine | 99.6 /100 | #67 | Exceptional 11.9% |
| Immigrants | Croatia | 99.6 /100 | #68 | Exceptional 11.9% |
| Immigrants | Russia | 99.6 /100 | #69 | Exceptional 11.9% |
| Immigrants | Nepal | 99.6 /100 | #70 | Exceptional 11.9% |
| Immigrants | Greece | 99.6 /100 | #71 | Exceptional 11.9% |
| Immigrants | Argentina | 99.5 /100 | #72 | Exceptional 11.9% |
| Argentineans | 99.5 /100 | #73 | Exceptional 11.9% |
| Chileans | 99.5 /100 | #74 | Exceptional 11.9% |
| Uruguayans | 99.4 /100 | #75 | Exceptional 11.9% |
| Immigrants | Northern Africa | 99.4 /100 | #76 | Exceptional 11.9% |
| Immigrants | Malaysia | 99.2 /100 | #77 | Exceptional 12.0% |
| Immigrants | Venezuela | 99.1 /100 | #78 | Exceptional 12.0% |
| Immigrants | Belgium | 99.0 /100 | #79 | Exceptional 12.0% |
Demographics Similar to Sudanese by Single Male Poverty
In terms of single male poverty, the demographic groups most similar to Sudanese are Immigrants from Western Africa (13.1%, a difference of 0.010%), Mexican American Indian (13.1%, a difference of 0.020%), Immigrants from Haiti (13.1%, a difference of 0.080%), Swedish (13.1%, a difference of 0.080%), and Northern European (13.0%, a difference of 0.10%).
| Demographics | Rating | Rank | Single Male Poverty |
| Slovenes | 21.6 /100 | #200 | Fair 13.0% |
| Trinidadians and Tobagonians | 21.4 /100 | #201 | Fair 13.0% |
| Basques | 20.7 /100 | #202 | Fair 13.0% |
| Immigrants | Bangladesh | 20.4 /100 | #203 | Fair 13.0% |
| Estonians | 20.3 /100 | #204 | Fair 13.0% |
| Poles | 19.3 /100 | #205 | Poor 13.0% |
| Northern Europeans | 18.9 /100 | #206 | Poor 13.0% |
| Sudanese | 17.7 /100 | #207 | Poor 13.1% |
| Immigrants | Western Africa | 17.6 /100 | #208 | Poor 13.1% |
| Mexican American Indians | 17.5 /100 | #209 | Poor 13.1% |
| Immigrants | Haiti | 16.8 /100 | #210 | Poor 13.1% |
| Swedes | 16.8 /100 | #211 | Poor 13.1% |
| Senegalese | 16.4 /100 | #212 | Poor 13.1% |
| Italians | 15.9 /100 | #213 | Poor 13.1% |
| Zimbabweans | 14.9 /100 | #214 | Poor 13.1% |