Paraguayan vs Mexican American Indian Child Poverty Among Girls Under 16
COMPARE
Paraguayan
Mexican American Indian
Child Poverty Among Girls Under 16
Child Poverty Among Girls Under 16 Comparison
Paraguayans
Mexican American Indians
15.0%
CHILD POVERTY AMONG GIRLS UNDER 16
95.7/ 100
METRIC RATING
100th/ 347
METRIC RANK
19.5%
CHILD POVERTY AMONG GIRLS UNDER 16
0.2/ 100
METRIC RATING
260th/ 347
METRIC RANK
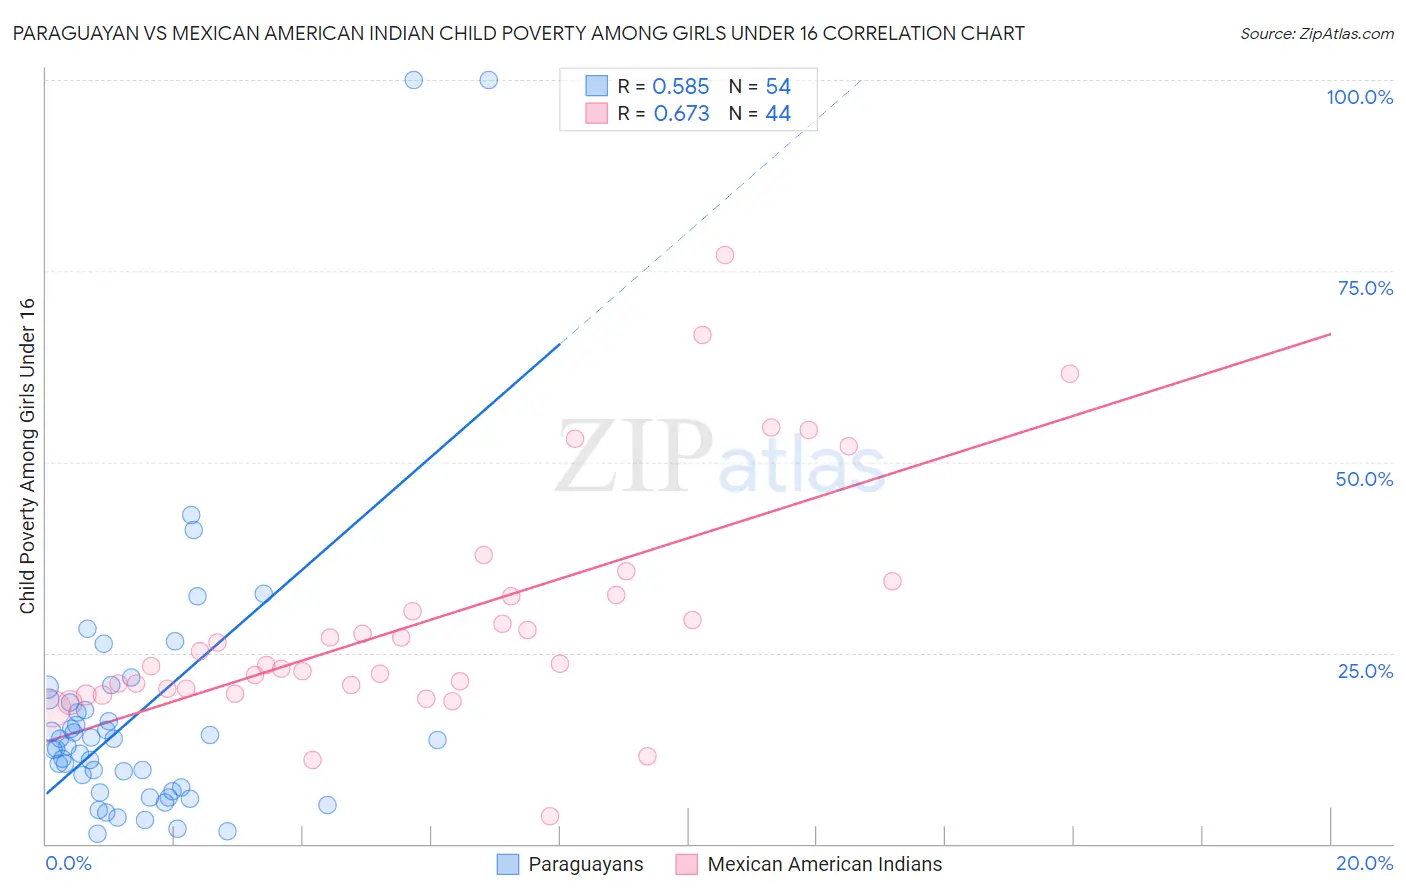
Paraguayan vs Mexican American Indian Child Poverty Among Girls Under 16 Correlation Chart
The statistical analysis conducted on geographies consisting of 94,658,687 people shows a substantial positive correlation between the proportion of Paraguayans and poverty level among girls under the age of 16 in the United States with a correlation coefficient (R) of 0.585 and weighted average of 15.0%. Similarly, the statistical analysis conducted on geographies consisting of 315,250,046 people shows a significant positive correlation between the proportion of Mexican American Indians and poverty level among girls under the age of 16 in the United States with a correlation coefficient (R) of 0.673 and weighted average of 19.5%, a difference of 30.0%.
Child Poverty Among Girls Under 16 Correlation Summary
| Measurement | Paraguayan | Mexican American Indian |
| Minimum | 1.2% | 3.6% |
| Maximum | 100.0% | 77.1% |
| Range | 98.8% | 73.5% |
| Mean | 17.1% | 29.2% |
| Median | 13.2% | 23.5% |
| Interquartile 25% (IQ1) | 6.9% | 20.3% |
| Interquartile 75% (IQ3) | 18.5% | 32.5% |
| Interquartile Range (IQR) | 11.6% | 12.2% |
| Standard Deviation (Sample) | 18.8% | 15.3% |
| Standard Deviation (Population) | 18.6% | 15.1% |
Similar Demographics by Child Poverty Among Girls Under 16
Demographics Similar to Paraguayans by Child Poverty Among Girls Under 16
In terms of child poverty among girls under 16, the demographic groups most similar to Paraguayans are Immigrants from South Africa (15.0%, a difference of 0.030%), Immigrants from Egypt (15.0%, a difference of 0.040%), Immigrants from Malaysia (15.0%, a difference of 0.050%), British (15.0%, a difference of 0.070%), and Basque (15.0%, a difference of 0.20%).
| Demographics | Rating | Rank | Child Poverty Among Girls Under 16 |
| Immigrants | North America | 96.6 /100 | #93 | Exceptional 14.9% |
| Immigrants | Switzerland | 96.3 /100 | #94 | Exceptional 14.9% |
| Germans | 96.3 /100 | #95 | Exceptional 14.9% |
| Immigrants | France | 96.2 /100 | #96 | Exceptional 14.9% |
| Immigrants | Latvia | 96.1 /100 | #97 | Exceptional 14.9% |
| Basques | 95.9 /100 | #98 | Exceptional 15.0% |
| Immigrants | Egypt | 95.7 /100 | #99 | Exceptional 15.0% |
| Paraguayans | 95.7 /100 | #100 | Exceptional 15.0% |
| Immigrants | South Africa | 95.6 /100 | #101 | Exceptional 15.0% |
| Immigrants | Malaysia | 95.6 /100 | #102 | Exceptional 15.0% |
| British | 95.6 /100 | #103 | Exceptional 15.0% |
| Romanians | 95.3 /100 | #104 | Exceptional 15.0% |
| Immigrants | England | 95.1 /100 | #105 | Exceptional 15.1% |
| Chileans | 95.1 /100 | #106 | Exceptional 15.1% |
| Immigrants | Ukraine | 95.0 /100 | #107 | Exceptional 15.1% |
Demographics Similar to Mexican American Indians by Child Poverty Among Girls Under 16
In terms of child poverty among girls under 16, the demographic groups most similar to Mexican American Indians are Vietnamese (19.5%, a difference of 0.090%), Ottawa (19.4%, a difference of 0.58%), Chickasaw (19.6%, a difference of 0.61%), Salvadoran (19.4%, a difference of 0.67%), and Immigrants from Burma/Myanmar (19.7%, a difference of 0.73%).
| Demographics | Rating | Rank | Child Poverty Among Girls Under 16 |
| Immigrants | Guyana | 0.3 /100 | #253 | Tragic 19.3% |
| Immigrants | Western Africa | 0.3 /100 | #254 | Tragic 19.3% |
| Immigrants | Ecuador | 0.3 /100 | #255 | Tragic 19.3% |
| Trinidadians and Tobagonians | 0.2 /100 | #256 | Tragic 19.3% |
| Guyanese | 0.2 /100 | #257 | Tragic 19.4% |
| Salvadorans | 0.2 /100 | #258 | Tragic 19.4% |
| Ottawa | 0.2 /100 | #259 | Tragic 19.4% |
| Mexican American Indians | 0.2 /100 | #260 | Tragic 19.5% |
| Vietnamese | 0.2 /100 | #261 | Tragic 19.5% |
| Chickasaw | 0.1 /100 | #262 | Tragic 19.6% |
| Immigrants | Burma/Myanmar | 0.1 /100 | #263 | Tragic 19.7% |
| Jamaicans | 0.1 /100 | #264 | Tragic 19.7% |
| Immigrants | Jamaica | 0.1 /100 | #265 | Tragic 19.8% |
| Spanish Americans | 0.1 /100 | #266 | Tragic 19.8% |
| Immigrants | Bangladesh | 0.1 /100 | #267 | Tragic 19.9% |