Immigrants from Argentina vs Celtic 2nd Grade
COMPARE
Immigrants from Argentina
Celtic
2nd Grade
2nd Grade Comparison
Immigrants from Argentina
Celtics
97.8%
2ND GRADE
40.6/ 100
METRIC RATING
185th/ 347
METRIC RANK
98.4%
2ND GRADE
99.8/ 100
METRIC RATING
49th/ 347
METRIC RANK
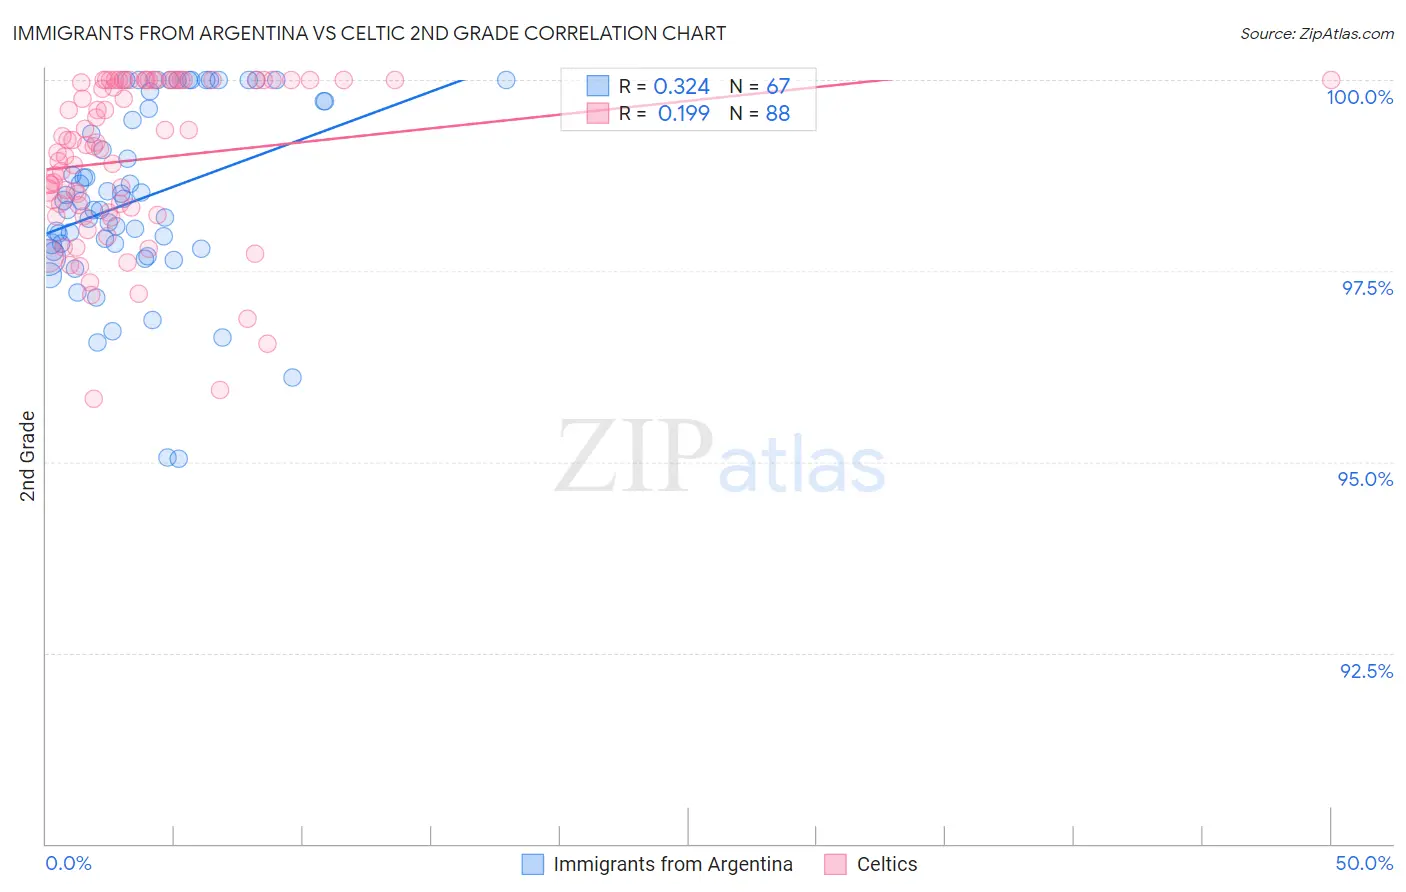
Immigrants from Argentina vs Celtic 2nd Grade Correlation Chart
The statistical analysis conducted on geographies consisting of 264,429,773 people shows a mild positive correlation between the proportion of Immigrants from Argentina and percentage of population with at least 2nd grade education in the United States with a correlation coefficient (R) of 0.324 and weighted average of 97.8%. Similarly, the statistical analysis conducted on geographies consisting of 168,875,705 people shows a poor positive correlation between the proportion of Celtics and percentage of population with at least 2nd grade education in the United States with a correlation coefficient (R) of 0.199 and weighted average of 98.4%, a difference of 0.53%.
2nd Grade Correlation Summary
| Measurement | Immigrants from Argentina | Celtic |
| Minimum | 95.0% | 95.8% |
| Maximum | 100.0% | 100.0% |
| Range | 5.0% | 4.2% |
| Mean | 98.4% | 99.0% |
| Median | 98.4% | 99.1% |
| Interquartile 25% (IQ1) | 97.8% | 98.3% |
| Interquartile 75% (IQ3) | 99.7% | 100.0% |
| Interquartile Range (IQR) | 1.9% | 1.7% |
| Standard Deviation (Sample) | 1.2% | 1.0% |
| Standard Deviation (Population) | 1.2% | 1.0% |
Similar Demographics by 2nd Grade
Demographics Similar to Immigrants from Argentina by 2nd Grade
In terms of 2nd grade, the demographic groups most similar to Immigrants from Argentina are Immigrants from Belarus (97.8%, a difference of 0.0%), Native/Alaskan (97.9%, a difference of 0.010%), Egyptian (97.9%, a difference of 0.010%), Portuguese (97.8%, a difference of 0.010%), and Immigrants from Poland (97.8%, a difference of 0.010%).
| Demographics | Rating | Rank | 2nd Grade |
| Argentineans | 46.3 /100 | #178 | Average 97.9% |
| Immigrants | Venezuela | 46.1 /100 | #179 | Average 97.9% |
| Natives/Alaskans | 44.3 /100 | #180 | Average 97.9% |
| Egyptians | 44.3 /100 | #181 | Average 97.9% |
| Portuguese | 42.4 /100 | #182 | Average 97.8% |
| Immigrants | Poland | 42.2 /100 | #183 | Average 97.8% |
| Immigrants | Belarus | 41.5 /100 | #184 | Average 97.8% |
| Immigrants | Argentina | 40.6 /100 | #185 | Average 97.8% |
| Arabs | 36.9 /100 | #186 | Fair 97.8% |
| Pakistanis | 36.1 /100 | #187 | Fair 97.8% |
| Immigrants | Kazakhstan | 35.6 /100 | #188 | Fair 97.8% |
| Panamanians | 33.5 /100 | #189 | Fair 97.8% |
| Immigrants | Taiwan | 31.8 /100 | #190 | Fair 97.8% |
| Paraguayans | 30.8 /100 | #191 | Fair 97.8% |
| Blacks/African Americans | 29.9 /100 | #192 | Fair 97.8% |
Demographics Similar to Celtics by 2nd Grade
In terms of 2nd grade, the demographic groups most similar to Celtics are White/Caucasian (98.4%, a difference of 0.0%), Estonian (98.4%, a difference of 0.0%), Australian (98.4%, a difference of 0.0%), Czechoslovakian (98.4%, a difference of 0.010%), and Pueblo (98.3%, a difference of 0.010%).
| Demographics | Rating | Rank | 2nd Grade |
| Native Hawaiians | 99.9 /100 | #42 | Exceptional 98.4% |
| Belgians | 99.9 /100 | #43 | Exceptional 98.4% |
| Northern Europeans | 99.9 /100 | #44 | Exceptional 98.4% |
| Hungarians | 99.9 /100 | #45 | Exceptional 98.4% |
| Lumbee | 99.9 /100 | #46 | Exceptional 98.4% |
| Ottawa | 99.9 /100 | #47 | Exceptional 98.4% |
| Czechoslovakians | 99.9 /100 | #48 | Exceptional 98.4% |
| Celtics | 99.8 /100 | #49 | Exceptional 98.4% |
| Whites/Caucasians | 99.8 /100 | #50 | Exceptional 98.4% |
| Estonians | 99.8 /100 | #51 | Exceptional 98.4% |
| Australians | 99.8 /100 | #52 | Exceptional 98.4% |
| Pueblo | 99.8 /100 | #53 | Exceptional 98.3% |
| Kiowa | 99.8 /100 | #54 | Exceptional 98.3% |
| Immigrants | Scotland | 99.8 /100 | #55 | Exceptional 98.3% |
| Americans | 99.8 /100 | #56 | Exceptional 98.3% |