Immigrants from Albania vs Immigrants from Sierra Leone Female Poverty Among 18-24 Year Olds
COMPARE
Immigrants from Albania
Immigrants from Sierra Leone
Female Poverty Among 18-24 Year Olds
Female Poverty Among 18-24 Year Olds Comparison
Immigrants from Albania
Immigrants from Sierra Leone
18.5%
FEMALE POVERTY AMONG 18-24 YEAR OLDS
99.8/ 100
METRIC RATING
61st/ 347
METRIC RANK
19.2%
FEMALE POVERTY AMONG 18-24 YEAR OLDS
97.8/ 100
METRIC RATING
106th/ 347
METRIC RANK
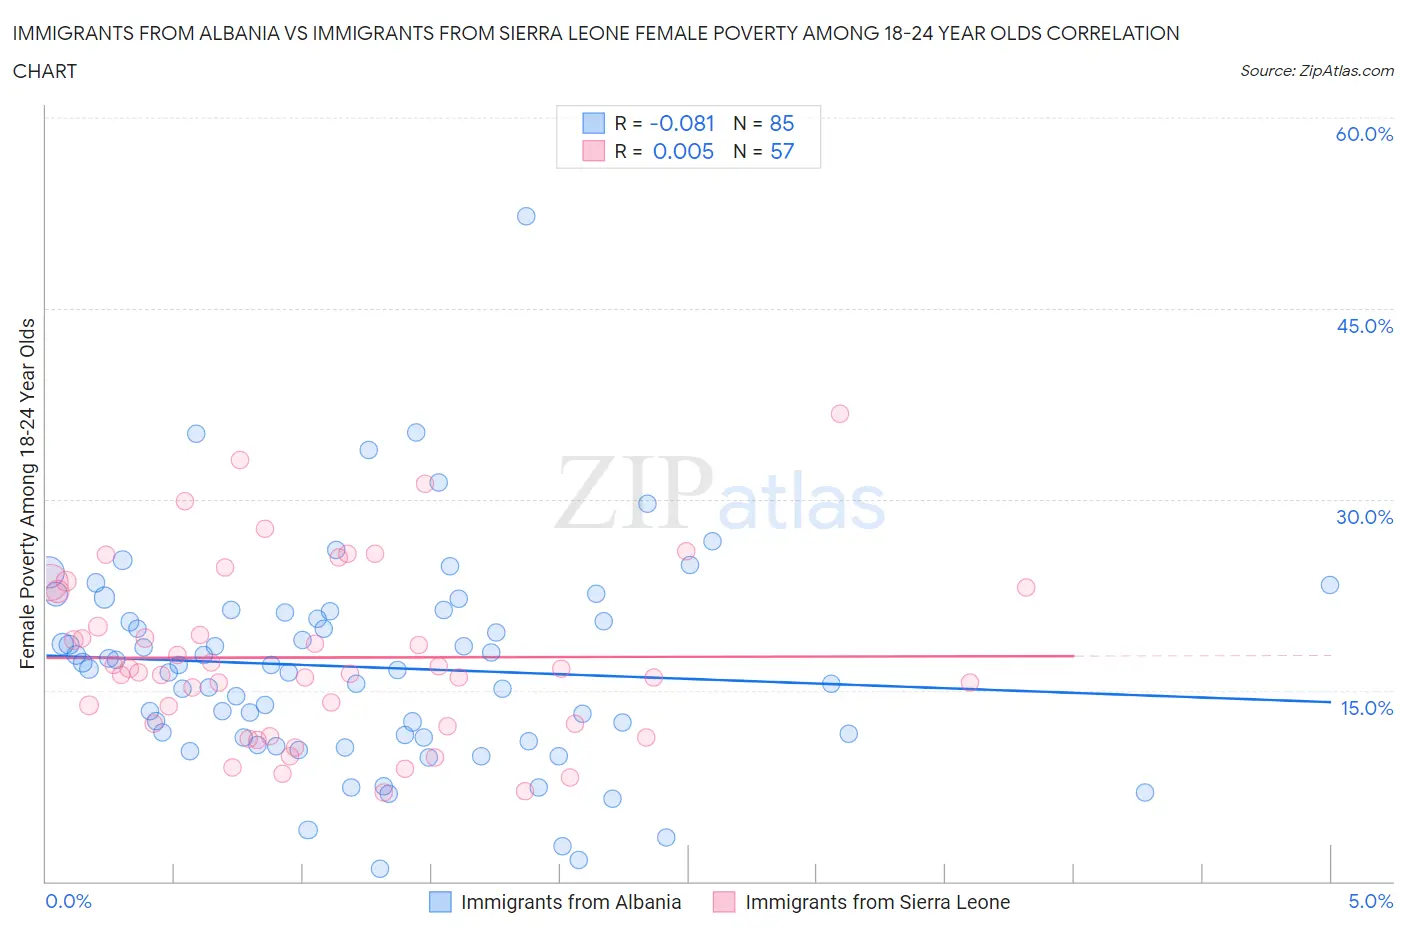
Immigrants from Albania vs Immigrants from Sierra Leone Female Poverty Among 18-24 Year Olds Correlation Chart
The statistical analysis conducted on geographies consisting of 118,032,486 people shows a slight negative correlation between the proportion of Immigrants from Albania and poverty level among females between the ages 18 and 24 in the United States with a correlation coefficient (R) of -0.081 and weighted average of 18.5%. Similarly, the statistical analysis conducted on geographies consisting of 100,931,142 people shows no correlation between the proportion of Immigrants from Sierra Leone and poverty level among females between the ages 18 and 24 in the United States with a correlation coefficient (R) of 0.005 and weighted average of 19.2%, a difference of 3.5%.
Female Poverty Among 18-24 Year Olds Correlation Summary
| Measurement | Immigrants from Albania | Immigrants from Sierra Leone |
| Minimum | 1.00% | 7.0% |
| Maximum | 52.3% | 36.8% |
| Range | 51.3% | 29.8% |
| Mean | 16.8% | 17.6% |
| Median | 16.7% | 16.4% |
| Interquartile 25% (IQ1) | 11.3% | 12.3% |
| Interquartile 75% (IQ3) | 21.2% | 22.9% |
| Interquartile Range (IQR) | 9.9% | 10.6% |
| Standard Deviation (Sample) | 8.2% | 6.8% |
| Standard Deviation (Population) | 8.2% | 6.8% |
Similar Demographics by Female Poverty Among 18-24 Year Olds
Demographics Similar to Immigrants from Albania by Female Poverty Among 18-24 Year Olds
In terms of female poverty among 18-24 year olds, the demographic groups most similar to Immigrants from Albania are Immigrants from Brazil (18.5%, a difference of 0.040%), Greek (18.5%, a difference of 0.070%), Immigrants from Belarus (18.5%, a difference of 0.080%), Immigrants from Asia (18.6%, a difference of 0.11%), and Immigrants from Scotland (18.6%, a difference of 0.14%).
| Demographics | Rating | Rank | Female Poverty Among 18-24 Year Olds |
| Immigrants | Egypt | 99.9 /100 | #54 | Exceptional 18.4% |
| Albanians | 99.9 /100 | #55 | Exceptional 18.4% |
| Argentineans | 99.9 /100 | #56 | Exceptional 18.4% |
| Immigrants | Italy | 99.9 /100 | #57 | Exceptional 18.4% |
| Immigrants | Ukraine | 99.9 /100 | #58 | Exceptional 18.4% |
| Egyptians | 99.9 /100 | #59 | Exceptional 18.5% |
| Immigrants | Brazil | 99.8 /100 | #60 | Exceptional 18.5% |
| Immigrants | Albania | 99.8 /100 | #61 | Exceptional 18.5% |
| Greeks | 99.8 /100 | #62 | Exceptional 18.5% |
| Immigrants | Belarus | 99.8 /100 | #63 | Exceptional 18.5% |
| Immigrants | Asia | 99.8 /100 | #64 | Exceptional 18.6% |
| Immigrants | Scotland | 99.8 /100 | #65 | Exceptional 18.6% |
| Jordanians | 99.8 /100 | #66 | Exceptional 18.6% |
| Immigrants | Korea | 99.8 /100 | #67 | Exceptional 18.6% |
| Brazilians | 99.8 /100 | #68 | Exceptional 18.6% |
Demographics Similar to Immigrants from Sierra Leone by Female Poverty Among 18-24 Year Olds
In terms of female poverty among 18-24 year olds, the demographic groups most similar to Immigrants from Sierra Leone are Immigrants from Ecuador (19.2%, a difference of 0.040%), Immigrants from Afghanistan (19.1%, a difference of 0.12%), Immigrants from Sri Lanka (19.2%, a difference of 0.15%), Serbian (19.1%, a difference of 0.16%), and Immigrants from Caribbean (19.1%, a difference of 0.20%).
| Demographics | Rating | Rank | Female Poverty Among 18-24 Year Olds |
| Immigrants | Czechoslovakia | 98.3 /100 | #99 | Exceptional 19.1% |
| Chileans | 98.3 /100 | #100 | Exceptional 19.1% |
| Ecuadorians | 98.1 /100 | #101 | Exceptional 19.1% |
| Immigrants | Caribbean | 98.1 /100 | #102 | Exceptional 19.1% |
| Serbians | 98.0 /100 | #103 | Exceptional 19.1% |
| Immigrants | Afghanistan | 98.0 /100 | #104 | Exceptional 19.1% |
| Immigrants | Ecuador | 97.8 /100 | #105 | Exceptional 19.2% |
| Immigrants | Sierra Leone | 97.8 /100 | #106 | Exceptional 19.2% |
| Immigrants | Sri Lanka | 97.5 /100 | #107 | Exceptional 19.2% |
| Immigrants | Uzbekistan | 97.3 /100 | #108 | Exceptional 19.2% |
| Immigrants | Syria | 97.2 /100 | #109 | Exceptional 19.2% |
| Laotians | 97.1 /100 | #110 | Exceptional 19.2% |
| Immigrants | Serbia | 97.1 /100 | #111 | Exceptional 19.2% |
| Immigrants | El Salvador | 96.5 /100 | #112 | Exceptional 19.3% |
| Immigrants | Cameroon | 96.3 /100 | #113 | Exceptional 19.3% |