Immigrants from Africa vs Laotian Female Poverty Among 18-24 Year Olds
COMPARE
Immigrants from Africa
Laotian
Female Poverty Among 18-24 Year Olds
Female Poverty Among 18-24 Year Olds Comparison
Immigrants from Africa
Laotians
21.0%
FEMALE POVERTY AMONG 18-24 YEAR OLDS
3.0/ 100
METRIC RATING
247th/ 347
METRIC RANK
19.2%
FEMALE POVERTY AMONG 18-24 YEAR OLDS
97.1/ 100
METRIC RATING
110th/ 347
METRIC RANK
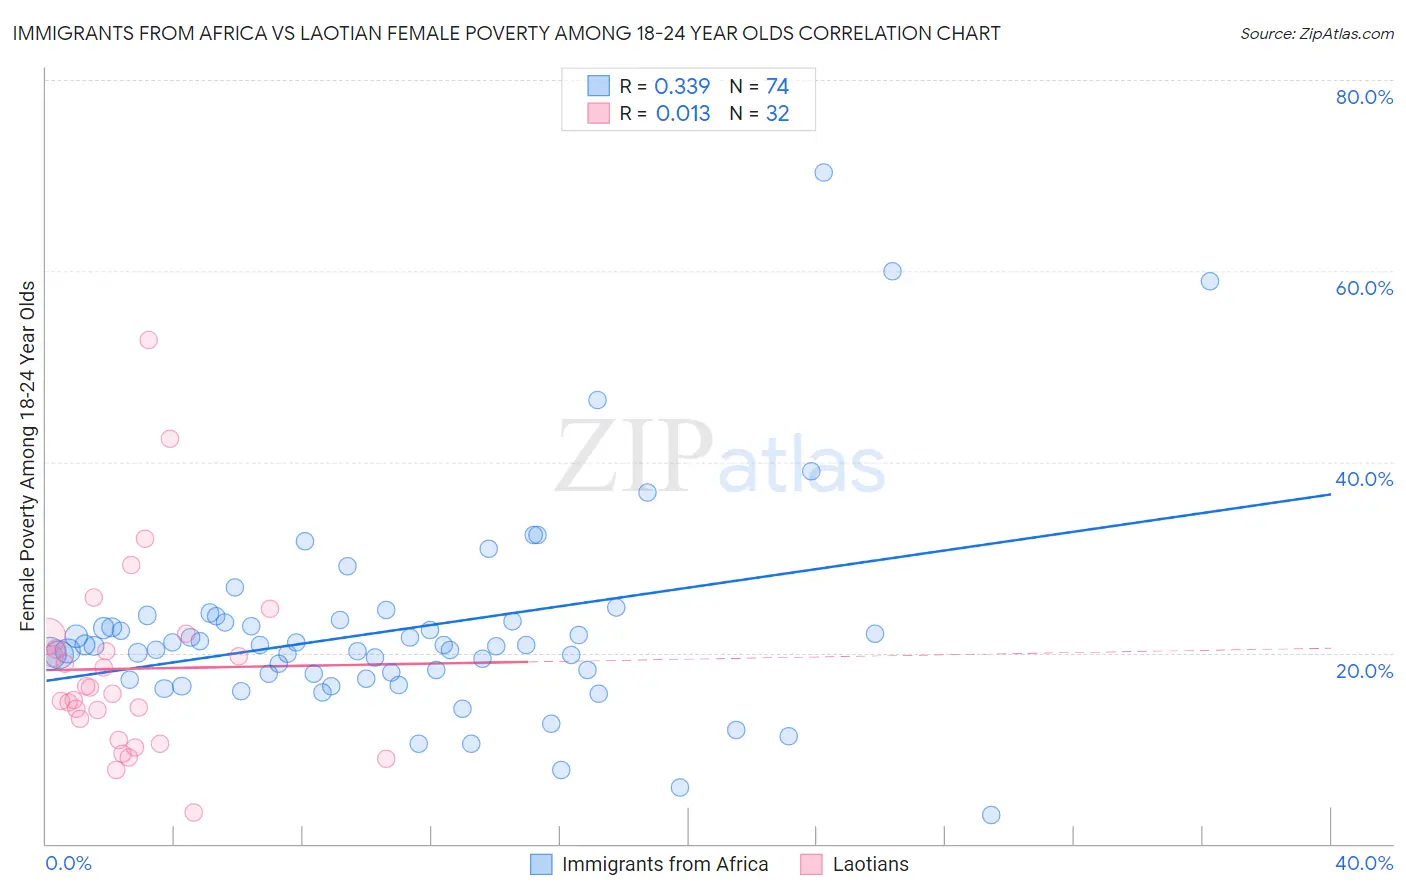
Immigrants from Africa vs Laotian Female Poverty Among 18-24 Year Olds Correlation Chart
The statistical analysis conducted on geographies consisting of 455,098,346 people shows a mild positive correlation between the proportion of Immigrants from Africa and poverty level among females between the ages 18 and 24 in the United States with a correlation coefficient (R) of 0.339 and weighted average of 21.0%. Similarly, the statistical analysis conducted on geographies consisting of 222,164,569 people shows no correlation between the proportion of Laotians and poverty level among females between the ages 18 and 24 in the United States with a correlation coefficient (R) of 0.013 and weighted average of 19.2%, a difference of 8.9%.
Female Poverty Among 18-24 Year Olds Correlation Summary
| Measurement | Immigrants from Africa | Laotian |
| Minimum | 3.0% | 3.3% |
| Maximum | 70.3% | 52.8% |
| Range | 67.3% | 49.5% |
| Mean | 22.4% | 18.3% |
| Median | 20.8% | 16.0% |
| Interquartile 25% (IQ1) | 17.8% | 12.0% |
| Interquartile 75% (IQ3) | 23.3% | 21.1% |
| Interquartile Range (IQR) | 5.5% | 9.1% |
| Standard Deviation (Sample) | 10.9% | 10.0% |
| Standard Deviation (Population) | 10.8% | 9.9% |
Similar Demographics by Female Poverty Among 18-24 Year Olds
Demographics Similar to Immigrants from Africa by Female Poverty Among 18-24 Year Olds
In terms of female poverty among 18-24 year olds, the demographic groups most similar to Immigrants from Africa are Immigrants from Australia (20.9%, a difference of 0.060%), Aleut (20.9%, a difference of 0.14%), Immigrants from Thailand (20.9%, a difference of 0.17%), Marshallese (20.9%, a difference of 0.18%), and Immigrants from Kenya (21.0%, a difference of 0.20%).
| Demographics | Rating | Rank | Female Poverty Among 18-24 Year Olds |
| Luxembourgers | 4.2 /100 | #240 | Tragic 20.9% |
| Immigrants | Eritrea | 4.2 /100 | #241 | Tragic 20.9% |
| Israelis | 4.1 /100 | #242 | Tragic 20.9% |
| Marshallese | 3.4 /100 | #243 | Tragic 20.9% |
| Immigrants | Thailand | 3.4 /100 | #244 | Tragic 20.9% |
| Aleuts | 3.3 /100 | #245 | Tragic 20.9% |
| Immigrants | Australia | 3.1 /100 | #246 | Tragic 20.9% |
| Immigrants | Africa | 3.0 /100 | #247 | Tragic 21.0% |
| Immigrants | Kenya | 2.5 /100 | #248 | Tragic 21.0% |
| Carpatho Rusyns | 2.5 /100 | #249 | Tragic 21.0% |
| Immigrants | West Indies | 2.2 /100 | #250 | Tragic 21.0% |
| West Indians | 1.9 /100 | #251 | Tragic 21.1% |
| South Africans | 1.6 /100 | #252 | Tragic 21.1% |
| Delaware | 1.6 /100 | #253 | Tragic 21.1% |
| British West Indians | 1.2 /100 | #254 | Tragic 21.2% |
Demographics Similar to Laotians by Female Poverty Among 18-24 Year Olds
In terms of female poverty among 18-24 year olds, the demographic groups most similar to Laotians are Immigrants from Serbia (19.2%, a difference of 0.020%), Immigrants from Syria (19.2%, a difference of 0.030%), Immigrants from Uzbekistan (19.2%, a difference of 0.11%), Immigrants from Sri Lanka (19.2%, a difference of 0.20%), and Immigrants from El Salvador (19.3%, a difference of 0.24%).
| Demographics | Rating | Rank | Female Poverty Among 18-24 Year Olds |
| Serbians | 98.0 /100 | #103 | Exceptional 19.1% |
| Immigrants | Afghanistan | 98.0 /100 | #104 | Exceptional 19.1% |
| Immigrants | Ecuador | 97.8 /100 | #105 | Exceptional 19.2% |
| Immigrants | Sierra Leone | 97.8 /100 | #106 | Exceptional 19.2% |
| Immigrants | Sri Lanka | 97.5 /100 | #107 | Exceptional 19.2% |
| Immigrants | Uzbekistan | 97.3 /100 | #108 | Exceptional 19.2% |
| Immigrants | Syria | 97.2 /100 | #109 | Exceptional 19.2% |
| Laotians | 97.1 /100 | #110 | Exceptional 19.2% |
| Immigrants | Serbia | 97.1 /100 | #111 | Exceptional 19.2% |
| Immigrants | El Salvador | 96.5 /100 | #112 | Exceptional 19.3% |
| Immigrants | Cameroon | 96.3 /100 | #113 | Exceptional 19.3% |
| Slovenes | 96.2 /100 | #114 | Exceptional 19.3% |
| Immigrants | Hungary | 96.2 /100 | #115 | Exceptional 19.3% |
| Immigrants | Immigrants | 95.9 /100 | #116 | Exceptional 19.3% |
| Immigrants | Iran | 95.8 /100 | #117 | Exceptional 19.3% |