Immigrants from Africa vs Immigrants from Liberia Female Poverty Among 18-24 Year Olds
COMPARE
Immigrants from Africa
Immigrants from Liberia
Female Poverty Among 18-24 Year Olds
Female Poverty Among 18-24 Year Olds Comparison
Immigrants from Africa
Immigrants from Liberia
21.0%
FEMALE POVERTY AMONG 18-24 YEAR OLDS
3.0/ 100
METRIC RATING
247th/ 347
METRIC RANK
20.7%
FEMALE POVERTY AMONG 18-24 YEAR OLDS
7.6/ 100
METRIC RATING
224th/ 347
METRIC RANK
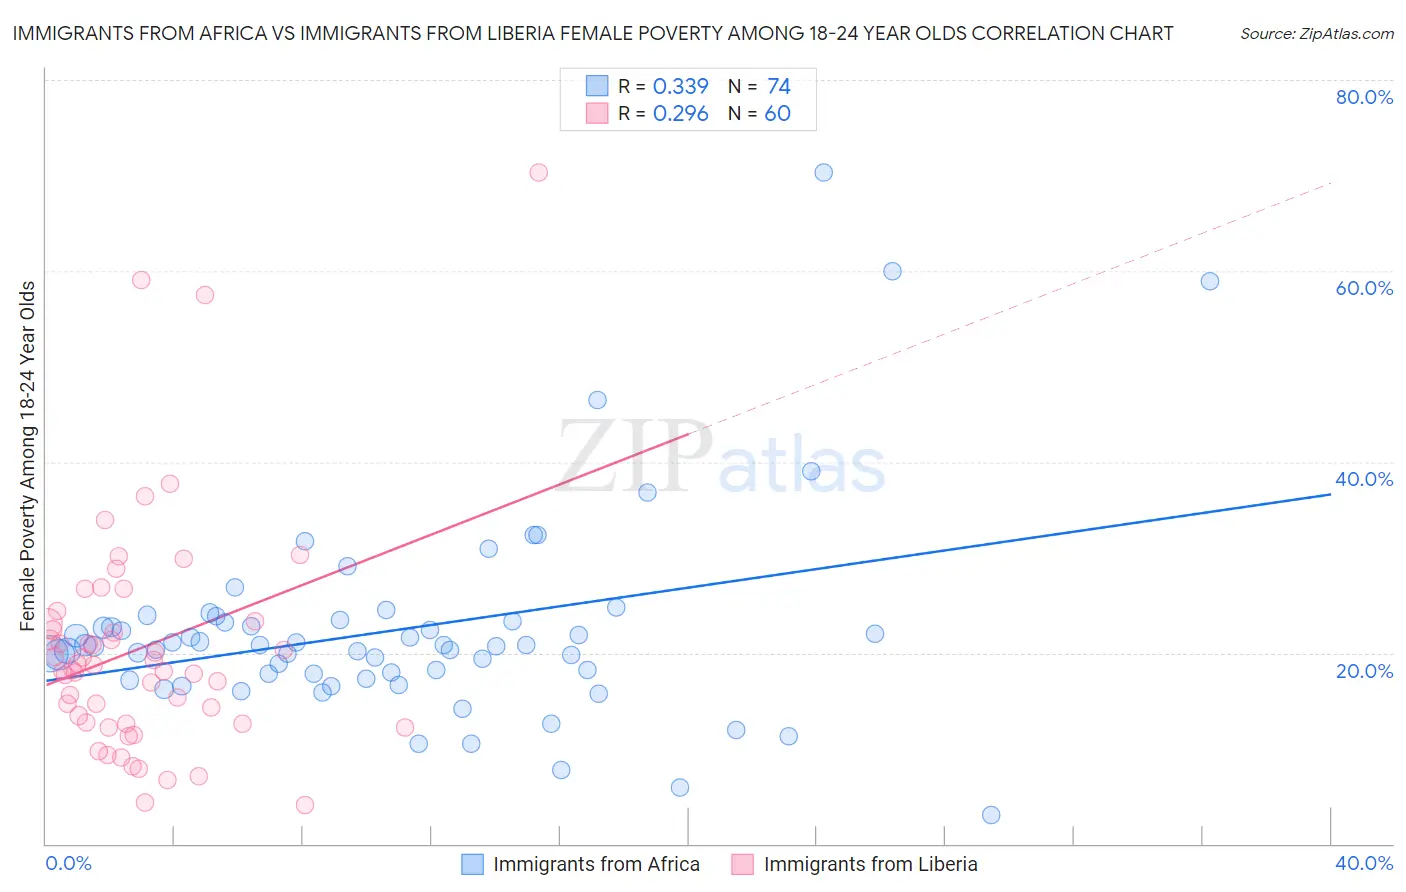
Immigrants from Africa vs Immigrants from Liberia Female Poverty Among 18-24 Year Olds Correlation Chart
The statistical analysis conducted on geographies consisting of 455,098,346 people shows a mild positive correlation between the proportion of Immigrants from Africa and poverty level among females between the ages 18 and 24 in the United States with a correlation coefficient (R) of 0.339 and weighted average of 21.0%. Similarly, the statistical analysis conducted on geographies consisting of 134,229,994 people shows a weak positive correlation between the proportion of Immigrants from Liberia and poverty level among females between the ages 18 and 24 in the United States with a correlation coefficient (R) of 0.296 and weighted average of 20.7%, a difference of 1.2%.
Female Poverty Among 18-24 Year Olds Correlation Summary
| Measurement | Immigrants from Africa | Immigrants from Liberia |
| Minimum | 3.0% | 4.0% |
| Maximum | 70.3% | 70.3% |
| Range | 67.3% | 66.3% |
| Mean | 22.4% | 20.5% |
| Median | 20.8% | 18.5% |
| Interquartile 25% (IQ1) | 17.8% | 12.7% |
| Interquartile 75% (IQ3) | 23.3% | 23.2% |
| Interquartile Range (IQR) | 5.5% | 10.5% |
| Standard Deviation (Sample) | 10.9% | 12.3% |
| Standard Deviation (Population) | 10.8% | 12.2% |
Similar Demographics by Female Poverty Among 18-24 Year Olds
Demographics Similar to Immigrants from Africa by Female Poverty Among 18-24 Year Olds
In terms of female poverty among 18-24 year olds, the demographic groups most similar to Immigrants from Africa are Immigrants from Australia (20.9%, a difference of 0.060%), Aleut (20.9%, a difference of 0.14%), Immigrants from Thailand (20.9%, a difference of 0.17%), Marshallese (20.9%, a difference of 0.18%), and Immigrants from Kenya (21.0%, a difference of 0.20%).
| Demographics | Rating | Rank | Female Poverty Among 18-24 Year Olds |
| Luxembourgers | 4.2 /100 | #240 | Tragic 20.9% |
| Immigrants | Eritrea | 4.2 /100 | #241 | Tragic 20.9% |
| Israelis | 4.1 /100 | #242 | Tragic 20.9% |
| Marshallese | 3.4 /100 | #243 | Tragic 20.9% |
| Immigrants | Thailand | 3.4 /100 | #244 | Tragic 20.9% |
| Aleuts | 3.3 /100 | #245 | Tragic 20.9% |
| Immigrants | Australia | 3.1 /100 | #246 | Tragic 20.9% |
| Immigrants | Africa | 3.0 /100 | #247 | Tragic 21.0% |
| Immigrants | Kenya | 2.5 /100 | #248 | Tragic 21.0% |
| Carpatho Rusyns | 2.5 /100 | #249 | Tragic 21.0% |
| Immigrants | West Indies | 2.2 /100 | #250 | Tragic 21.0% |
| West Indians | 1.9 /100 | #251 | Tragic 21.1% |
| South Africans | 1.6 /100 | #252 | Tragic 21.1% |
| Delaware | 1.6 /100 | #253 | Tragic 21.1% |
| British West Indians | 1.2 /100 | #254 | Tragic 21.2% |
Demographics Similar to Immigrants from Liberia by Female Poverty Among 18-24 Year Olds
In terms of female poverty among 18-24 year olds, the demographic groups most similar to Immigrants from Liberia are French (20.7%, a difference of 0.040%), Norwegian (20.7%, a difference of 0.060%), Guatemalan (20.7%, a difference of 0.070%), Estonian (20.7%, a difference of 0.080%), and Immigrants from Sweden (20.7%, a difference of 0.15%).
| Demographics | Rating | Rank | Female Poverty Among 18-24 Year Olds |
| Immigrants | Laos | 9.7 /100 | #217 | Tragic 20.6% |
| Immigrants | Nepal | 9.6 /100 | #218 | Tragic 20.7% |
| Immigrants | Micronesia | 9.6 /100 | #219 | Tragic 20.7% |
| British | 9.4 /100 | #220 | Tragic 20.7% |
| Barbadians | 9.0 /100 | #221 | Tragic 20.7% |
| Guatemalans | 8.1 /100 | #222 | Tragic 20.7% |
| French | 7.9 /100 | #223 | Tragic 20.7% |
| Immigrants | Liberia | 7.6 /100 | #224 | Tragic 20.7% |
| Norwegians | 7.3 /100 | #225 | Tragic 20.7% |
| Estonians | 7.2 /100 | #226 | Tragic 20.7% |
| Immigrants | Sweden | 6.8 /100 | #227 | Tragic 20.7% |
| Ghanaians | 6.5 /100 | #228 | Tragic 20.8% |
| Australians | 6.1 /100 | #229 | Tragic 20.8% |
| Whites/Caucasians | 6.1 /100 | #230 | Tragic 20.8% |
| Immigrants | St. Vincent and the Grenadines | 6.0 /100 | #231 | Tragic 20.8% |