Immigrants from Africa vs Blackfeet Family Poverty
COMPARE
Immigrants from Africa
Blackfeet
Family Poverty
Family Poverty Comparison
Immigrants from Africa
Blackfeet
9.9%
FAMILY POVERTY
4.3/ 100
METRIC RATING
223rd/ 347
METRIC RANK
11.3%
FAMILY POVERTY
0.0/ 100
METRIC RATING
279th/ 347
METRIC RANK
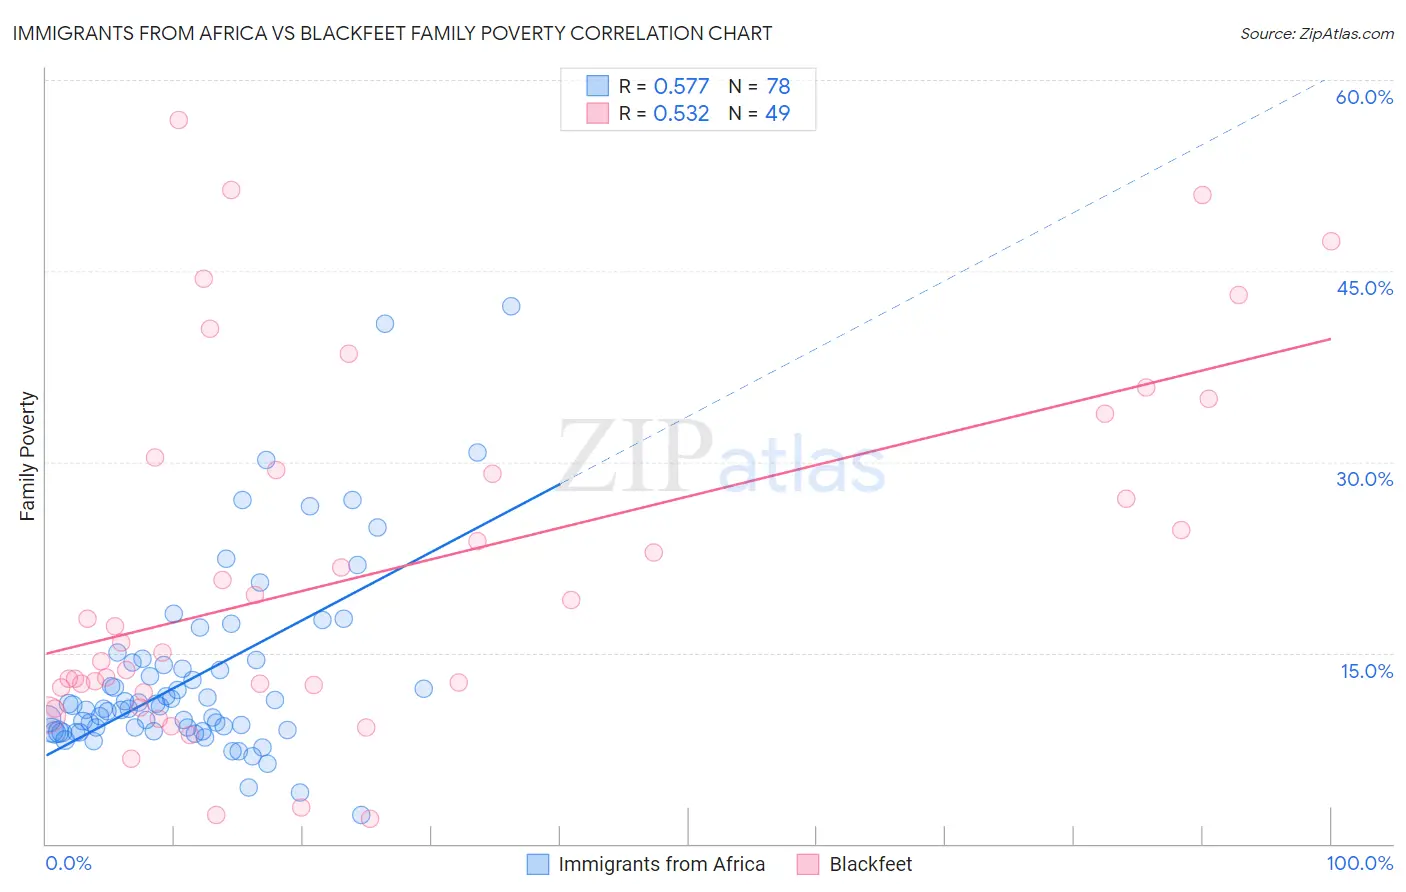
Immigrants from Africa vs Blackfeet Family Poverty Correlation Chart
The statistical analysis conducted on geographies consisting of 467,521,718 people shows a substantial positive correlation between the proportion of Immigrants from Africa and poverty level among families in the United States with a correlation coefficient (R) of 0.577 and weighted average of 9.9%. Similarly, the statistical analysis conducted on geographies consisting of 309,172,576 people shows a substantial positive correlation between the proportion of Blackfeet and poverty level among families in the United States with a correlation coefficient (R) of 0.532 and weighted average of 11.3%, a difference of 13.5%.
Family Poverty Correlation Summary
| Measurement | Immigrants from Africa | Blackfeet |
| Minimum | 2.2% | 2.0% |
| Maximum | 42.2% | 56.9% |
| Range | 40.0% | 54.9% |
| Mean | 13.1% | 21.4% |
| Median | 10.7% | 15.8% |
| Interquartile 25% (IQ1) | 8.9% | 12.1% |
| Interquartile 75% (IQ3) | 14.2% | 29.9% |
| Interquartile Range (IQR) | 5.3% | 17.8% |
| Standard Deviation (Sample) | 7.4% | 14.0% |
| Standard Deviation (Population) | 7.3% | 13.9% |
Similar Demographics by Family Poverty
Demographics Similar to Immigrants from Africa by Family Poverty
In terms of family poverty, the demographic groups most similar to Immigrants from Africa are Japanese (9.9%, a difference of 0.30%), Marshallese (9.9%, a difference of 0.30%), Immigrants from Cambodia (9.9%, a difference of 0.33%), Immigrants (10.0%, a difference of 0.55%), and Bermudan (9.9%, a difference of 0.61%).
| Demographics | Rating | Rank | Family Poverty |
| Moroccans | 6.5 /100 | #216 | Tragic 9.8% |
| Americans | 6.2 /100 | #217 | Tragic 9.8% |
| Panamanians | 5.6 /100 | #218 | Tragic 9.8% |
| Immigrants | Eritrea | 5.4 /100 | #219 | Tragic 9.9% |
| Bermudans | 5.3 /100 | #220 | Tragic 9.9% |
| Immigrants | Cambodia | 4.8 /100 | #221 | Tragic 9.9% |
| Japanese | 4.8 /100 | #222 | Tragic 9.9% |
| Immigrants | Africa | 4.3 /100 | #223 | Tragic 9.9% |
| Marshallese | 3.9 /100 | #224 | Tragic 9.9% |
| Immigrants | Immigrants | 3.6 /100 | #225 | Tragic 10.0% |
| Ottawa | 3.3 /100 | #226 | Tragic 10.0% |
| Immigrants | Armenia | 3.3 /100 | #227 | Tragic 10.0% |
| Sudanese | 3.1 /100 | #228 | Tragic 10.0% |
| Immigrants | Uzbekistan | 3.1 /100 | #229 | Tragic 10.0% |
| Immigrants | Panama | 3.1 /100 | #230 | Tragic 10.0% |
Demographics Similar to Blackfeet by Family Poverty
In terms of family poverty, the demographic groups most similar to Blackfeet are Belizean (11.3%, a difference of 0.040%), Guyanese (11.2%, a difference of 0.14%), Chippewa (11.2%, a difference of 0.16%), Immigrants from Guyana (11.2%, a difference of 0.25%), and Central American (11.2%, a difference of 0.28%).
| Demographics | Rating | Rank | Family Poverty |
| Immigrants | Jamaica | 0.1 /100 | #272 | Tragic 11.2% |
| Somalis | 0.1 /100 | #273 | Tragic 11.2% |
| Spanish Americans | 0.1 /100 | #274 | Tragic 11.2% |
| Central Americans | 0.1 /100 | #275 | Tragic 11.2% |
| Immigrants | Guyana | 0.1 /100 | #276 | Tragic 11.2% |
| Chippewa | 0.1 /100 | #277 | Tragic 11.2% |
| Guyanese | 0.1 /100 | #278 | Tragic 11.2% |
| Blackfeet | 0.0 /100 | #279 | Tragic 11.3% |
| Belizeans | 0.0 /100 | #280 | Tragic 11.3% |
| Immigrants | West Indies | 0.0 /100 | #281 | Tragic 11.3% |
| Immigrants | Cuba | 0.0 /100 | #282 | Tragic 11.3% |
| Indonesians | 0.0 /100 | #283 | Tragic 11.3% |
| Yaqui | 0.0 /100 | #284 | Tragic 11.3% |
| Barbadians | 0.0 /100 | #285 | Tragic 11.3% |
| Senegalese | 0.0 /100 | #286 | Tragic 11.5% |