Russian vs Blackfeet Family Poverty
COMPARE
Russian
Blackfeet
Family Poverty
Family Poverty Comparison
Russians
Blackfeet
7.5%
FAMILY POVERTY
99.5/ 100
METRIC RATING
34th/ 347
METRIC RANK
11.3%
FAMILY POVERTY
0.0/ 100
METRIC RATING
279th/ 347
METRIC RANK
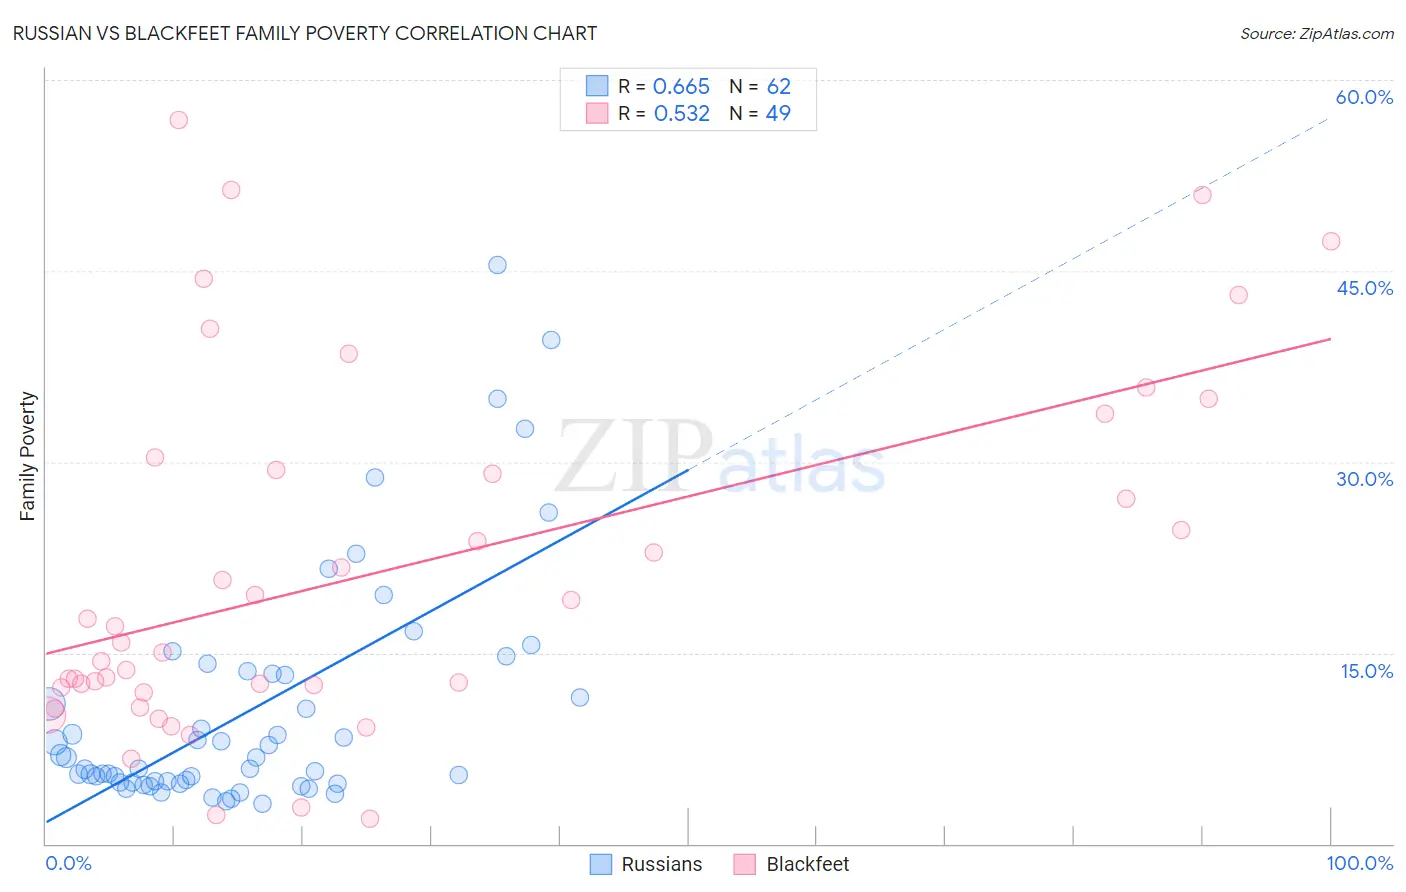
Russian vs Blackfeet Family Poverty Correlation Chart
The statistical analysis conducted on geographies consisting of 509,085,697 people shows a significant positive correlation between the proportion of Russians and poverty level among families in the United States with a correlation coefficient (R) of 0.665 and weighted average of 7.5%. Similarly, the statistical analysis conducted on geographies consisting of 309,172,576 people shows a substantial positive correlation between the proportion of Blackfeet and poverty level among families in the United States with a correlation coefficient (R) of 0.532 and weighted average of 11.3%, a difference of 51.0%.
Family Poverty Correlation Summary
| Measurement | Russian | Blackfeet |
| Minimum | 3.2% | 2.0% |
| Maximum | 45.5% | 56.9% |
| Range | 42.3% | 54.9% |
| Mean | 10.6% | 21.4% |
| Median | 6.3% | 15.8% |
| Interquartile 25% (IQ1) | 4.8% | 12.1% |
| Interquartile 75% (IQ3) | 13.4% | 29.9% |
| Interquartile Range (IQR) | 8.6% | 17.8% |
| Standard Deviation (Sample) | 9.4% | 14.0% |
| Standard Deviation (Population) | 9.3% | 13.9% |
Similar Demographics by Family Poverty
Demographics Similar to Russians by Family Poverty
In terms of family poverty, the demographic groups most similar to Russians are Polish (7.4%, a difference of 0.23%), Immigrants from Japan (7.4%, a difference of 0.23%), Czech (7.4%, a difference of 0.53%), Italian (7.4%, a difference of 0.65%), and Greek (7.5%, a difference of 0.73%).
| Demographics | Rating | Rank | Family Poverty |
| Immigrants | Scotland | 99.6 /100 | #27 | Exceptional 7.3% |
| Immigrants | Korea | 99.6 /100 | #28 | Exceptional 7.4% |
| Immigrants | Northern Europe | 99.6 /100 | #29 | Exceptional 7.4% |
| Italians | 99.6 /100 | #30 | Exceptional 7.4% |
| Czechs | 99.6 /100 | #31 | Exceptional 7.4% |
| Poles | 99.5 /100 | #32 | Exceptional 7.4% |
| Immigrants | Japan | 99.5 /100 | #33 | Exceptional 7.4% |
| Russians | 99.5 /100 | #34 | Exceptional 7.5% |
| Greeks | 99.4 /100 | #35 | Exceptional 7.5% |
| Turks | 99.4 /100 | #36 | Exceptional 7.5% |
| Estonians | 99.4 /100 | #37 | Exceptional 7.5% |
| Bolivians | 99.3 /100 | #38 | Exceptional 7.5% |
| Carpatho Rusyns | 99.3 /100 | #39 | Exceptional 7.5% |
| Slovenes | 99.3 /100 | #40 | Exceptional 7.5% |
| Immigrants | Australia | 99.2 /100 | #41 | Exceptional 7.6% |
Demographics Similar to Blackfeet by Family Poverty
In terms of family poverty, the demographic groups most similar to Blackfeet are Belizean (11.3%, a difference of 0.040%), Guyanese (11.2%, a difference of 0.14%), Chippewa (11.2%, a difference of 0.16%), Immigrants from Guyana (11.2%, a difference of 0.25%), and Central American (11.2%, a difference of 0.28%).
| Demographics | Rating | Rank | Family Poverty |
| Immigrants | Jamaica | 0.1 /100 | #272 | Tragic 11.2% |
| Somalis | 0.1 /100 | #273 | Tragic 11.2% |
| Spanish Americans | 0.1 /100 | #274 | Tragic 11.2% |
| Central Americans | 0.1 /100 | #275 | Tragic 11.2% |
| Immigrants | Guyana | 0.1 /100 | #276 | Tragic 11.2% |
| Chippewa | 0.1 /100 | #277 | Tragic 11.2% |
| Guyanese | 0.1 /100 | #278 | Tragic 11.2% |
| Blackfeet | 0.0 /100 | #279 | Tragic 11.3% |
| Belizeans | 0.0 /100 | #280 | Tragic 11.3% |
| Immigrants | West Indies | 0.0 /100 | #281 | Tragic 11.3% |
| Immigrants | Cuba | 0.0 /100 | #282 | Tragic 11.3% |
| Indonesians | 0.0 /100 | #283 | Tragic 11.3% |
| Yaqui | 0.0 /100 | #284 | Tragic 11.3% |
| Barbadians | 0.0 /100 | #285 | Tragic 11.3% |
| Senegalese | 0.0 /100 | #286 | Tragic 11.5% |