Ghanaian vs Blackfeet Family Poverty
COMPARE
Ghanaian
Blackfeet
Family Poverty
Family Poverty Comparison
Ghanaians
Blackfeet
10.3%
FAMILY POVERTY
1.3/ 100
METRIC RATING
241st/ 347
METRIC RANK
11.3%
FAMILY POVERTY
0.0/ 100
METRIC RATING
279th/ 347
METRIC RANK
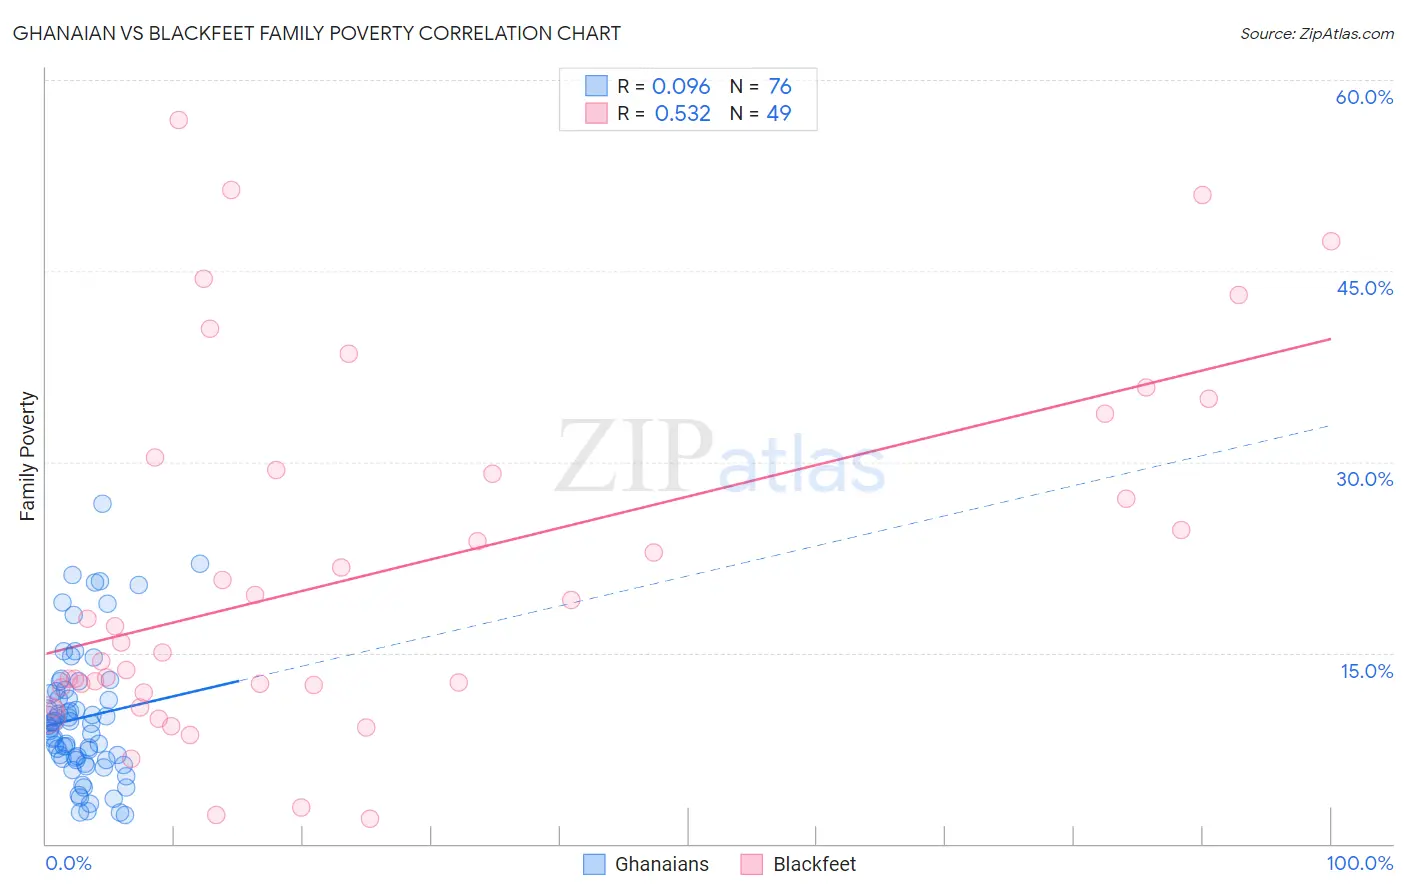
Ghanaian vs Blackfeet Family Poverty Correlation Chart
The statistical analysis conducted on geographies consisting of 190,166,438 people shows a slight positive correlation between the proportion of Ghanaians and poverty level among families in the United States with a correlation coefficient (R) of 0.096 and weighted average of 10.3%. Similarly, the statistical analysis conducted on geographies consisting of 309,172,576 people shows a substantial positive correlation between the proportion of Blackfeet and poverty level among families in the United States with a correlation coefficient (R) of 0.532 and weighted average of 11.3%, a difference of 9.5%.
Family Poverty Correlation Summary
| Measurement | Ghanaian | Blackfeet |
| Minimum | 2.3% | 2.0% |
| Maximum | 26.7% | 56.9% |
| Range | 24.4% | 54.9% |
| Mean | 9.9% | 21.4% |
| Median | 9.3% | 15.8% |
| Interquartile 25% (IQ1) | 6.6% | 12.1% |
| Interquartile 75% (IQ3) | 11.9% | 29.9% |
| Interquartile Range (IQR) | 5.3% | 17.8% |
| Standard Deviation (Sample) | 5.1% | 14.0% |
| Standard Deviation (Population) | 5.1% | 13.9% |
Similar Demographics by Family Poverty
Demographics Similar to Ghanaians by Family Poverty
In terms of family poverty, the demographic groups most similar to Ghanaians are Immigrants from the Azores (10.3%, a difference of 0.090%), Potawatomi (10.2%, a difference of 0.39%), French American Indian (10.2%, a difference of 0.43%), Immigrants from Laos (10.2%, a difference of 0.80%), and Alaska Native (10.4%, a difference of 0.86%).
| Demographics | Rating | Rank | Family Poverty |
| Immigrants | Middle Africa | 2.1 /100 | #234 | Tragic 10.1% |
| Nigerians | 2.0 /100 | #235 | Tragic 10.1% |
| Immigrants | Nigeria | 1.9 /100 | #236 | Tragic 10.2% |
| Immigrants | Laos | 1.7 /100 | #237 | Tragic 10.2% |
| French American Indians | 1.5 /100 | #238 | Tragic 10.2% |
| Potawatomi | 1.5 /100 | #239 | Tragic 10.2% |
| Immigrants | Azores | 1.4 /100 | #240 | Tragic 10.3% |
| Ghanaians | 1.3 /100 | #241 | Tragic 10.3% |
| Alaska Natives | 1.0 /100 | #242 | Tragic 10.4% |
| Nepalese | 0.8 /100 | #243 | Tragic 10.4% |
| Cree | 0.7 /100 | #244 | Tragic 10.5% |
| Immigrants | Burma/Myanmar | 0.6 /100 | #245 | Tragic 10.5% |
| Cherokee | 0.5 /100 | #246 | Tragic 10.6% |
| Liberians | 0.4 /100 | #247 | Tragic 10.6% |
| Nicaraguans | 0.4 /100 | #248 | Tragic 10.6% |
Demographics Similar to Blackfeet by Family Poverty
In terms of family poverty, the demographic groups most similar to Blackfeet are Belizean (11.3%, a difference of 0.040%), Guyanese (11.2%, a difference of 0.14%), Chippewa (11.2%, a difference of 0.16%), Immigrants from Guyana (11.2%, a difference of 0.25%), and Central American (11.2%, a difference of 0.28%).
| Demographics | Rating | Rank | Family Poverty |
| Immigrants | Jamaica | 0.1 /100 | #272 | Tragic 11.2% |
| Somalis | 0.1 /100 | #273 | Tragic 11.2% |
| Spanish Americans | 0.1 /100 | #274 | Tragic 11.2% |
| Central Americans | 0.1 /100 | #275 | Tragic 11.2% |
| Immigrants | Guyana | 0.1 /100 | #276 | Tragic 11.2% |
| Chippewa | 0.1 /100 | #277 | Tragic 11.2% |
| Guyanese | 0.1 /100 | #278 | Tragic 11.2% |
| Blackfeet | 0.0 /100 | #279 | Tragic 11.3% |
| Belizeans | 0.0 /100 | #280 | Tragic 11.3% |
| Immigrants | West Indies | 0.0 /100 | #281 | Tragic 11.3% |
| Immigrants | Cuba | 0.0 /100 | #282 | Tragic 11.3% |
| Indonesians | 0.0 /100 | #283 | Tragic 11.3% |
| Yaqui | 0.0 /100 | #284 | Tragic 11.3% |
| Barbadians | 0.0 /100 | #285 | Tragic 11.3% |
| Senegalese | 0.0 /100 | #286 | Tragic 11.5% |