Immigrants from Africa vs Blackfeet Per Capita Income
COMPARE
Immigrants from Africa
Blackfeet
Per Capita Income
Per Capita Income Comparison
Immigrants from Africa
Blackfeet
$42,950
PER CAPITA INCOME
31.0/ 100
METRIC RATING
188th/ 347
METRIC RANK
$37,695
PER CAPITA INCOME
0.1/ 100
METRIC RATING
288th/ 347
METRIC RANK
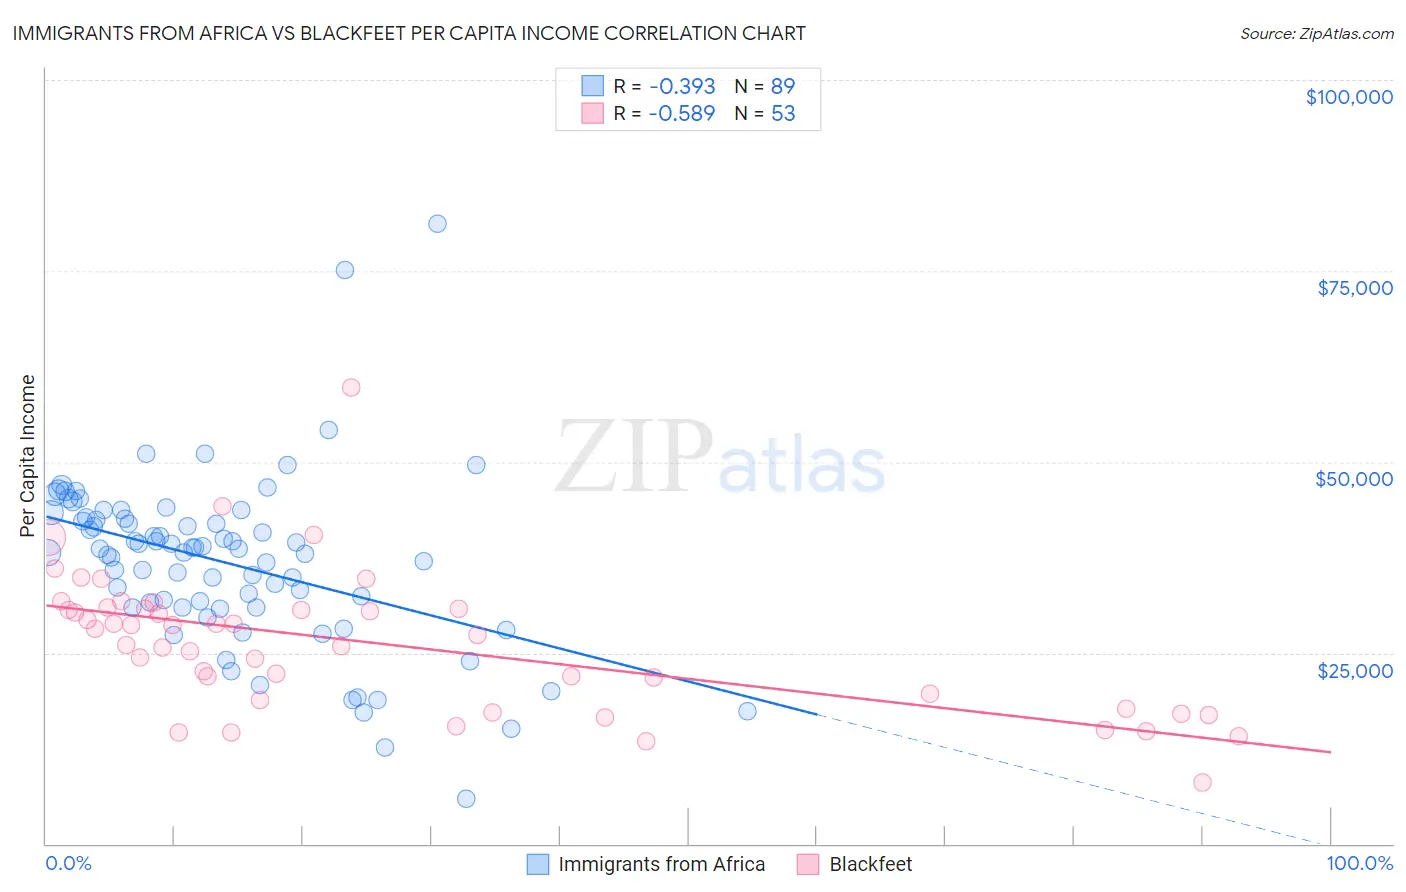
Immigrants from Africa vs Blackfeet Per Capita Income Correlation Chart
The statistical analysis conducted on geographies consisting of 469,482,271 people shows a mild negative correlation between the proportion of Immigrants from Africa and per capita income in the United States with a correlation coefficient (R) of -0.393 and weighted average of $42,950. Similarly, the statistical analysis conducted on geographies consisting of 309,586,612 people shows a substantial negative correlation between the proportion of Blackfeet and per capita income in the United States with a correlation coefficient (R) of -0.589 and weighted average of $37,695, a difference of 13.9%.
Per Capita Income Correlation Summary
| Measurement | Immigrants from Africa | Blackfeet |
| Minimum | $5,866 | $7,946 |
| Maximum | $81,151 | $59,700 |
| Range | $75,285 | $51,754 |
| Mean | $36,831 | $26,182 |
| Median | $38,619 | $27,256 |
| Interquartile 25% (IQ1) | $30,955 | $18,286 |
| Interquartile 75% (IQ3) | $42,606 | $30,810 |
| Interquartile Range (IQR) | $11,650 | $12,524 |
| Standard Deviation (Sample) | $11,377 | $9,146 |
| Standard Deviation (Population) | $11,312 | $9,059 |
Similar Demographics by Per Capita Income
Demographics Similar to Immigrants from Africa by Per Capita Income
In terms of per capita income, the demographic groups most similar to Immigrants from Africa are Immigrants from Colombia ($42,971, a difference of 0.050%), Bermudan ($42,911, a difference of 0.090%), French Canadian ($43,003, a difference of 0.12%), Immigrants ($43,010, a difference of 0.14%), and Spaniard ($43,028, a difference of 0.18%).
| Demographics | Rating | Rank | Per Capita Income |
| Welsh | 38.2 /100 | #181 | Fair $43,233 |
| Immigrants | Vietnam | 38.1 /100 | #182 | Fair $43,229 |
| Germans | 33.9 /100 | #183 | Fair $43,067 |
| Spaniards | 32.9 /100 | #184 | Fair $43,028 |
| Immigrants | Immigrants | 32.5 /100 | #185 | Fair $43,010 |
| French Canadians | 32.3 /100 | #186 | Fair $43,003 |
| Immigrants | Colombia | 31.5 /100 | #187 | Fair $42,971 |
| Immigrants | Africa | 31.0 /100 | #188 | Fair $42,950 |
| Bermudans | 30.1 /100 | #189 | Fair $42,911 |
| Kenyans | 27.7 /100 | #190 | Fair $42,808 |
| Yugoslavians | 27.4 /100 | #191 | Fair $42,792 |
| Iraqis | 26.7 /100 | #192 | Fair $42,760 |
| Immigrants | Sierra Leone | 26.5 /100 | #193 | Fair $42,752 |
| Immigrants | Fiji | 25.2 /100 | #194 | Fair $42,694 |
| Immigrants | Kenya | 24.5 /100 | #195 | Fair $42,661 |
Demographics Similar to Blackfeet by Per Capita Income
In terms of per capita income, the demographic groups most similar to Blackfeet are Dominican ($37,697, a difference of 0.0%), Central American Indian ($37,699, a difference of 0.010%), Guatemalan ($37,766, a difference of 0.19%), African ($37,785, a difference of 0.24%), and U.S. Virgin Islander ($37,589, a difference of 0.28%).
| Demographics | Rating | Rank | Per Capita Income |
| Immigrants | Dominica | 0.2 /100 | #281 | Tragic $37,952 |
| Immigrants | Laos | 0.1 /100 | #282 | Tragic $37,857 |
| Pennsylvania Germans | 0.1 /100 | #283 | Tragic $37,842 |
| Africans | 0.1 /100 | #284 | Tragic $37,785 |
| Guatemalans | 0.1 /100 | #285 | Tragic $37,766 |
| Central American Indians | 0.1 /100 | #286 | Tragic $37,699 |
| Dominicans | 0.1 /100 | #287 | Tragic $37,697 |
| Blackfeet | 0.1 /100 | #288 | Tragic $37,695 |
| U.S. Virgin Islanders | 0.1 /100 | #289 | Tragic $37,589 |
| Immigrants | Guatemala | 0.1 /100 | #290 | Tragic $37,550 |
| Cajuns | 0.1 /100 | #291 | Tragic $37,527 |
| Immigrants | Micronesia | 0.1 /100 | #292 | Tragic $37,464 |
| Mexican American Indians | 0.1 /100 | #293 | Tragic $37,407 |
| Cubans | 0.1 /100 | #294 | Tragic $37,383 |
| Immigrants | Dominican Republic | 0.1 /100 | #295 | Tragic $37,306 |