Immigrants from Afghanistan vs Pennsylvania German Male Poverty
COMPARE
Immigrants from Afghanistan
Pennsylvania German
Male Poverty
Male Poverty Comparison
Immigrants from Afghanistan
Pennsylvania Germans
11.4%
MALE POVERTY
33.3/ 100
METRIC RATING
185th/ 347
METRIC RANK
11.2%
MALE POVERTY
50.5/ 100
METRIC RATING
173rd/ 347
METRIC RANK
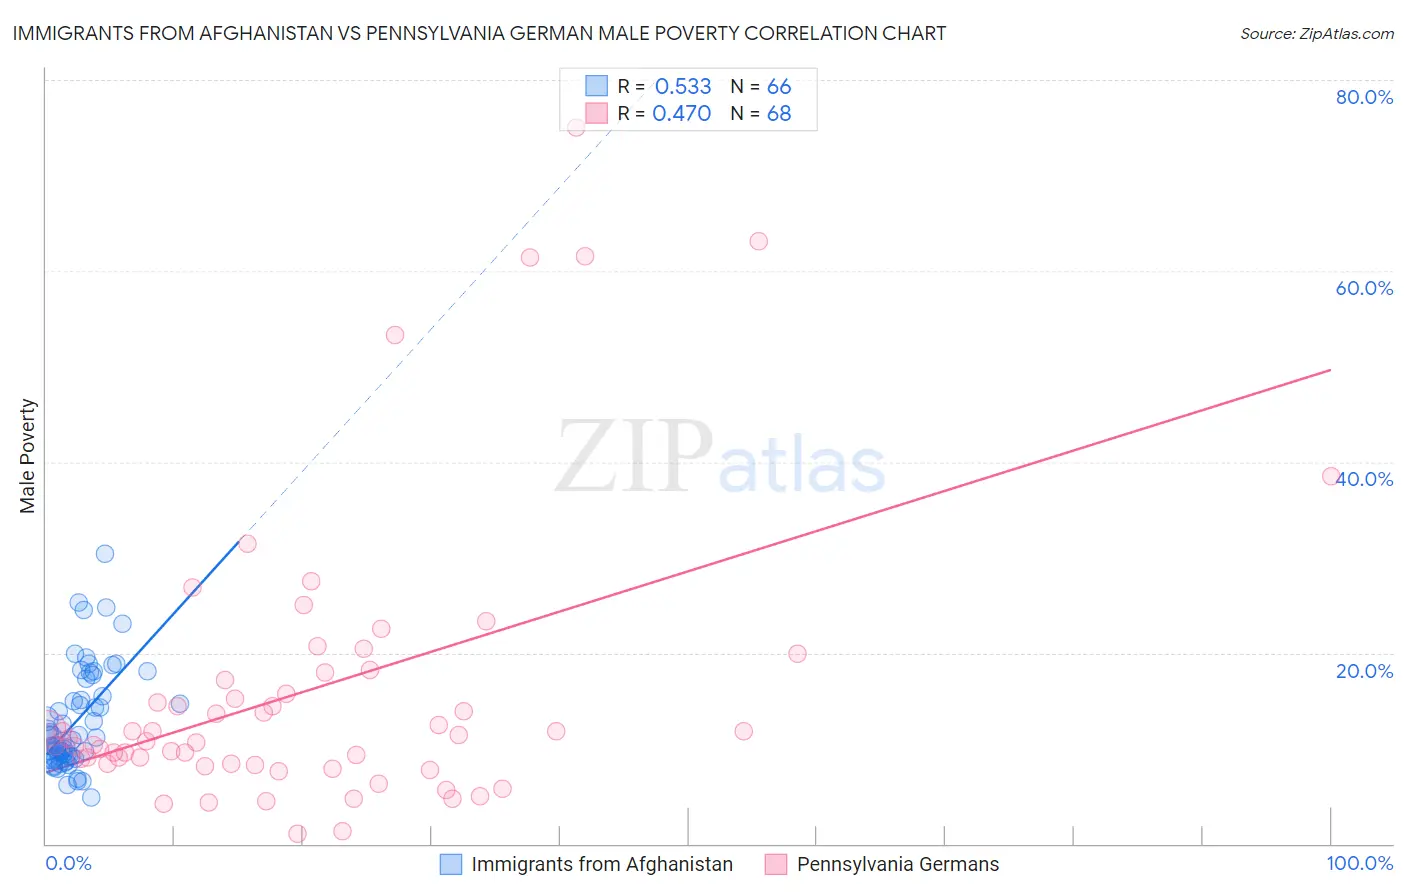
Immigrants from Afghanistan vs Pennsylvania German Male Poverty Correlation Chart
The statistical analysis conducted on geographies consisting of 147,624,521 people shows a substantial positive correlation between the proportion of Immigrants from Afghanistan and poverty level among males in the United States with a correlation coefficient (R) of 0.533 and weighted average of 11.4%. Similarly, the statistical analysis conducted on geographies consisting of 233,970,359 people shows a moderate positive correlation between the proportion of Pennsylvania Germans and poverty level among males in the United States with a correlation coefficient (R) of 0.470 and weighted average of 11.2%, a difference of 1.8%.
Male Poverty Correlation Summary
| Measurement | Immigrants from Afghanistan | Pennsylvania German |
| Minimum | 4.9% | 1.1% |
| Maximum | 30.4% | 75.0% |
| Range | 25.5% | 73.9% |
| Mean | 12.8% | 16.1% |
| Median | 11.0% | 11.2% |
| Interquartile 25% (IQ1) | 9.1% | 8.3% |
| Interquartile 75% (IQ3) | 15.5% | 17.5% |
| Interquartile Range (IQR) | 6.4% | 9.2% |
| Standard Deviation (Sample) | 5.3% | 15.1% |
| Standard Deviation (Population) | 5.3% | 15.0% |
Demographics Similar to Immigrants from Afghanistan and Pennsylvania Germans by Male Poverty
In terms of male poverty, the demographic groups most similar to Immigrants from Afghanistan are Immigrants from Sierra Leone (11.4%, a difference of 0.050%), Immigrants from Iraq (11.4%, a difference of 0.16%), Immigrants from South America (11.3%, a difference of 0.38%), Sierra Leonean (11.4%, a difference of 0.38%), and Kenyan (11.3%, a difference of 0.54%). Similarly, the demographic groups most similar to Pennsylvania Germans are Immigrants from Ethiopia (11.2%, a difference of 0.020%), Immigrants from Oceania (11.2%, a difference of 0.040%), Uruguayan (11.2%, a difference of 0.060%), Celtic (11.2%, a difference of 0.29%), and South American (11.1%, a difference of 0.32%).
| Demographics | Rating | Rank | Male Poverty |
| Immigrants | Colombia | 54.2 /100 | #169 | Average 11.1% |
| South Americans | 53.8 /100 | #170 | Average 11.1% |
| Uruguayans | 51.0 /100 | #171 | Average 11.2% |
| Immigrants | Ethiopia | 50.7 /100 | #172 | Average 11.2% |
| Pennsylvania Germans | 50.5 /100 | #173 | Average 11.2% |
| Immigrants | Oceania | 50.0 /100 | #174 | Average 11.2% |
| Celtics | 47.5 /100 | #175 | Average 11.2% |
| Immigrants | Fiji | 46.0 /100 | #176 | Average 11.2% |
| Lebanese | 45.6 /100 | #177 | Average 11.2% |
| Immigrants | Cameroon | 44.5 /100 | #178 | Average 11.2% |
| Immigrants | Syria | 40.3 /100 | #179 | Average 11.3% |
| Immigrants | Morocco | 40.1 /100 | #180 | Average 11.3% |
| Immigrants | Costa Rica | 39.5 /100 | #181 | Fair 11.3% |
| Mongolians | 39.0 /100 | #182 | Fair 11.3% |
| Kenyans | 38.4 /100 | #183 | Fair 11.3% |
| Immigrants | South America | 36.9 /100 | #184 | Fair 11.3% |
| Immigrants | Afghanistan | 33.3 /100 | #185 | Fair 11.4% |
| Immigrants | Sierra Leone | 32.9 /100 | #186 | Fair 11.4% |
| Immigrants | Iraq | 31.9 /100 | #187 | Fair 11.4% |
| Sierra Leoneans | 29.9 /100 | #188 | Fair 11.4% |
| Hawaiians | 28.3 /100 | #189 | Fair 11.4% |