Immigrants from Cambodia vs Uruguayan Child Poverty Among Boys Under 16
COMPARE
Immigrants from Cambodia
Uruguayan
Child Poverty Among Boys Under 16
Child Poverty Among Boys Under 16 Comparison
Immigrants from Cambodia
Uruguayans
17.8%
CHILD POVERTY AMONG BOYS UNDER 16
5.1/ 100
METRIC RATING
220th/ 347
METRIC RANK
16.4%
CHILD POVERTY AMONG BOYS UNDER 16
50.0/ 100
METRIC RATING
174th/ 347
METRIC RANK
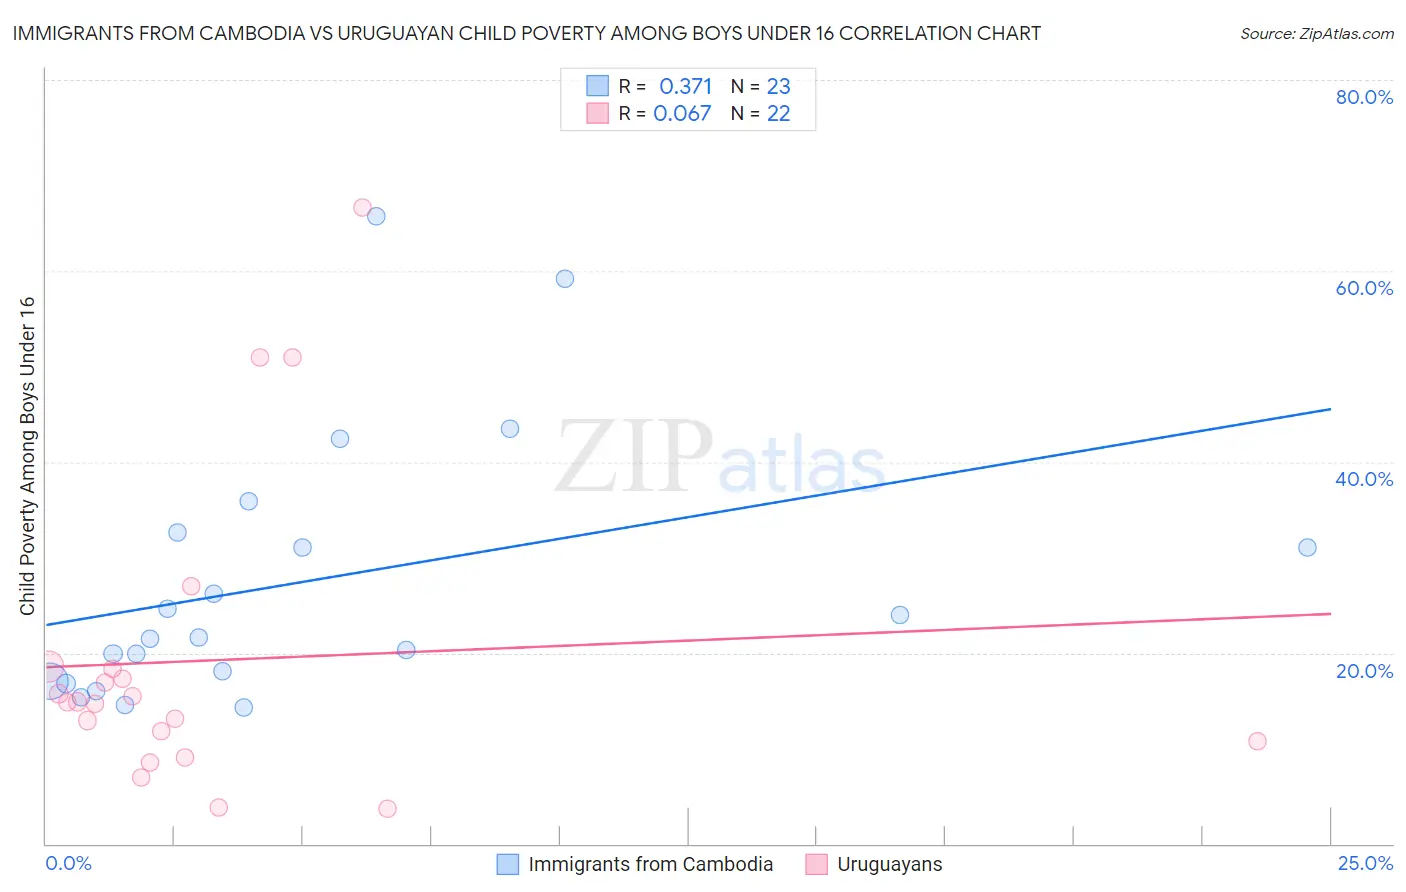
Immigrants from Cambodia vs Uruguayan Child Poverty Among Boys Under 16 Correlation Chart
The statistical analysis conducted on geographies consisting of 204,241,702 people shows a mild positive correlation between the proportion of Immigrants from Cambodia and poverty level among boys under the age of 16 in the United States with a correlation coefficient (R) of 0.371 and weighted average of 17.8%. Similarly, the statistical analysis conducted on geographies consisting of 143,820,486 people shows a slight positive correlation between the proportion of Uruguayans and poverty level among boys under the age of 16 in the United States with a correlation coefficient (R) of 0.067 and weighted average of 16.4%, a difference of 8.2%.
Child Poverty Among Boys Under 16 Correlation Summary
| Measurement | Immigrants from Cambodia | Uruguayan |
| Minimum | 14.3% | 3.7% |
| Maximum | 65.7% | 66.7% |
| Range | 51.5% | 63.0% |
| Mean | 27.4% | 19.2% |
| Median | 21.6% | 14.9% |
| Interquartile 25% (IQ1) | 17.0% | 10.7% |
| Interquartile 75% (IQ3) | 32.6% | 18.3% |
| Interquartile Range (IQR) | 15.7% | 7.6% |
| Standard Deviation (Sample) | 13.9% | 16.2% |
| Standard Deviation (Population) | 13.6% | 15.8% |
Similar Demographics by Child Poverty Among Boys Under 16
Demographics Similar to Immigrants from Cambodia by Child Poverty Among Boys Under 16
In terms of child poverty among boys under 16, the demographic groups most similar to Immigrants from Cambodia are Sierra Leonean (17.8%, a difference of 0.13%), Iraqi (17.7%, a difference of 0.21%), Japanese (17.7%, a difference of 0.23%), Moroccan (17.7%, a difference of 0.26%), and Osage (17.7%, a difference of 0.35%).
| Demographics | Rating | Rank | Child Poverty Among Boys Under 16 |
| Immigrants | Eastern Africa | 6.0 /100 | #213 | Tragic 17.7% |
| Panamanians | 5.9 /100 | #214 | Tragic 17.7% |
| Osage | 5.8 /100 | #215 | Tragic 17.7% |
| Moroccans | 5.6 /100 | #216 | Tragic 17.7% |
| Japanese | 5.5 /100 | #217 | Tragic 17.7% |
| Iraqis | 5.5 /100 | #218 | Tragic 17.7% |
| Sierra Leoneans | 5.3 /100 | #219 | Tragic 17.8% |
| Immigrants | Cambodia | 5.1 /100 | #220 | Tragic 17.8% |
| Immigrants | Panama | 4.3 /100 | #221 | Tragic 17.9% |
| Pennsylvania Germans | 3.9 /100 | #222 | Tragic 17.9% |
| Cubans | 3.8 /100 | #223 | Tragic 17.9% |
| Nepalese | 3.2 /100 | #224 | Tragic 18.0% |
| Inupiat | 2.7 /100 | #225 | Tragic 18.1% |
| Immigrants | Africa | 2.6 /100 | #226 | Tragic 18.1% |
| Bermudans | 2.5 /100 | #227 | Tragic 18.1% |
Demographics Similar to Uruguayans by Child Poverty Among Boys Under 16
In terms of child poverty among boys under 16, the demographic groups most similar to Uruguayans are Tsimshian (16.4%, a difference of 0.060%), Immigrants from Colombia (16.4%, a difference of 0.090%), Immigrants from Syria (16.5%, a difference of 0.11%), Immigrants from Ethiopia (16.4%, a difference of 0.14%), and Immigrants from Bosnia and Herzegovina (16.4%, a difference of 0.19%).
| Demographics | Rating | Rank | Child Poverty Among Boys Under 16 |
| Afghans | 55.4 /100 | #167 | Average 16.3% |
| South Americans | 55.3 /100 | #168 | Average 16.3% |
| Immigrants | Saudi Arabia | 53.6 /100 | #169 | Average 16.4% |
| Immigrants | Bosnia and Herzegovina | 51.7 /100 | #170 | Average 16.4% |
| Immigrants | Ethiopia | 51.3 /100 | #171 | Average 16.4% |
| Immigrants | Colombia | 50.8 /100 | #172 | Average 16.4% |
| Tsimshian | 50.5 /100 | #173 | Average 16.4% |
| Uruguayans | 50.0 /100 | #174 | Average 16.4% |
| Immigrants | Syria | 49.0 /100 | #175 | Average 16.5% |
| Whites/Caucasians | 48.2 /100 | #176 | Average 16.5% |
| Ethiopians | 47.8 /100 | #177 | Average 16.5% |
| Scotch-Irish | 47.5 /100 | #178 | Average 16.5% |
| Hungarians | 47.3 /100 | #179 | Average 16.5% |
| Hawaiians | 45.5 /100 | #180 | Average 16.5% |
| South American Indians | 44.3 /100 | #181 | Average 16.5% |